
Earlier in 2020, the coronavirus pandemic cast new light on a divide that has impacted millions of Americans for decades. The lack of access to affordable, robust broadband was already a massive economic and humanitarian issue before this year. Now, with millions of students potentially returning to classes online this fall, it is an unprecedented educational crisis in the making.
Key Findings
- We’ve identified 101 counties where less than half of the population is wired for broadband, and at least 30% of families with children ages 5 to 17 live below the poverty line.
- A total of 966,134 school-aged children (5-17) live in counties with less than 50% wired broadband coverage, many of which are expected to participate in online learning this fall amidst the ongoing coronavirus pandemic.
- 230,986 school-aged children live in counties with less that 50% wired broadband coverage and at least 30% of households living in poverty.
- Over 30 of these “internet desert” counties are in just three states: Georgia, Missouri, and Arkansas.
Internet Desert Counties
There are counties across the U.S. in which access to the internet has remained largely unestablished. Most of these are in less-populated rural regions, but combined, the 101 counties amount to 966,134 children ages 5-17 that are faced with the prospect of being left behind if their district is forced to cancel in-person classes this fall.
Several of the counties we’ve identified have virtually no access to broadband at all – the direct result of a systemic failure in the current system of broadband deployment, which primarily leaves planning and execution to the private sector.
Additionally, income generally skews lower in rural communities relative to urban ones, and this disparity makes measuring the true digital divide in the U.S. even harder than it appears on paper. Though an area may have access to at least one wired connection, that plan may not be affordable to thousands of families living and working in the community. We’ve previously identified that the average cost of a wired standalone broadband internet plan in the U.S. is $79. Only 50% of Americans have access to a standalone plan that costs less than $60 per month.
Below you can view each county organized by state, along with its associated level of wired broadband access and percent of the population living in poverty:
| County Name | No. of School Aged Children Total | No. of School Aged Children in Poverty | Wired Broadband Penetration | Est. Children Without Broadband |
|---|---|---|---|---|
| Adair County, OK | 4,111 | 1,473 | 44.54% | 2280 |
| Alexander County, IL | 987 | 432 | 33.61% | 655 |
| Amite County, MS | 1,835 | 578 | 23.36% | 1406 |
| Apache County, AZ | 14,537 | 6,495 | 0.16% | 14514 |
| Avoyelles Parish, LA | 6,773 | 2,535 | 26.16% | 5001 |
| Baker County, GA | 425 | 181 | 32.34% | 288 |
| Benson County, ND | 1,681 | 590 | 37.60% | 1049 |
| Benton County, MO | 2,405 | 764 | 34.25% | 1581 |
| Bethel Census Area, AK | 4,407 | 1,715 | 0.00% | 4407 |
| Bienville Parish, LA | 2,161 | 742 | 28.11% | 1554 |
| Big Horn County, MT | 3,165 | 1,004 | 49.31% | 1604 |
| Bledsoe County, TN | 1,555 | 544 | 40.77% | 921 |
| Calhoun County, GA | 857 | 307 | 44.85% | 473 |
| Carter County, MO | 1,008 | 355 | 19.20% | 814 |
| Catahoula Parish, LA | 1,498 | 530 | 1.12% | 1481 |
| Catron County, NM | 301 | 120 | 14.58% | 257 |
| Cibola County, NM | 4,496 | 1,467 | 23.24% | 3451 |
| Clay County, WV | 1,391 | 432 | 25.44% | 1037 |
| Conecuh County, AL | 1,872 | 728 | 46.43% | 1003 |
| Dallas County, AR | 985 | 319 | 37.36% | 617 |
| Dillingham Census Area, AK | 1,050 | 316 | 0.00% | 1050 |
| Dixie County, FL | 2,218 | 667 | 29.55% | 1563 |
| Early County, GA | 1,903 | 724 | 39.74% | 1147 |
| Echols County, GA | 791 | 266 | 26.55% | 581 |
| Edwards County, TX | 311 | 116 | 47.60% | 163 |
| Elliott County, KY | 998 | 299 | 15.22% | 846 |
| Evangeline Parish, LA | 5,967 | 1,955 | 47.49% | 3133 |
| Fayette County, AL | 2,514 | 982 | 23.42% | 1925 |
| Glacier County, MT | 2,841 | 962 | 25.96% | 2104 |
| Greene County, AL | 1,345 | 571 | 44.04% | 753 |
| Greene County, NC | 3,123 | 1,000 | 48.98% | 1593 |
| Hickory County, MO | 1,159 | 374 | 14.38% | 992 |
| Hidalgo County, NM | 682 | 225 | 2.13% | 668 |
| Holmes County, FL | 2,742 | 835 | 42.71% | 1571 |
| Hughes County, OK | 2,045 | 613 | 35.73% | 1314 |
| Hyde County, NC | 653 | 200 | 22.79% | 504 |
| Issaquena County, MS | 95 | 49 | 15.93% | 80 |
| Jeff Davis County, TX | 62 | 26 | 30.19% | 43 |
| Jefferson County, GA | 2,607 | 920 | 8.34% | 2390 |
| Jefferson County, OK | 1,064 | 410 | 2.55% | 1037 |
| Jim Hogg County, TX | 1,191 | 427 | 0.09% | 1190 |
| Johnson County, GA | 1,305 | 409 | 28.73% | 930 |
| Kemper County, MS | 1,369 | 479 | 48.36% | 707 |
| Lafayette County, AR | 854 | 300 | 40.86% | 505 |
| Lake County, MI | 1,339 | 478 | 30.77% | 927 |
| Lee County, AR | 1,156 | 536 | 32.63% | 779 |
| Lincoln County, MT | 2,597 | 803 | 19.59% | 2088 |
| Lowndes County, AL | 1,630 | 654 | 17.58% | 1343 |
| Marengo County, AL | 3,096 | 1,025 | 44.59% | 1716 |
| Marlboro County, SC | 3,822 | 1,640 | 0.57% | 3800 |
| McCormick County, SC | 793 | 255 | 42.27% | 458 |
| McIntosh County, OK | 2,853 | 1,021 | 36.90% | 1800 |
| McKinley County, NM | 15,320 | 6,899 | 39.58% | 9257 |
| Mecklenburg County, VA | 4,138 | 1,270 | 49.75% | 2079 |
| Menard County, TX | 286 | 115 | 1.74% | 281 |
| Monroe County, AR | 981 | 393 | 16.93% | 815 |
| Montgomery County, AR | 1,178 | 367 | 42.75% | 674 |
| Montmorency County, MI | 1,011 | 304 | 0.43% | 1007 |
| Mora County, NM | 583 | 176 | 32.06% | 396 |
| Navajo County, AZ | 21,438 | 8,735 | 45.38% | 11710 |
| Newton County, AR | 1,091 | 339 | 13.37% | 945 |
| Newton County, MS | 3,997 | 1,238 | 46.45% | 2141 |
| Oregon County, MO | 1,703 | 598 | 26.70% | 1248 |
| Ozark County, MO | 1,283 | 387 | 6.07% | 1205 |
| Perry County, AL | 1,423 | 707 | 0.00% | 1423 |
| Perry County, MS | 1,965 | 653 | 24.52% | 1483 |
| Powell County, KY | 2,066 | 642 | 42.32% | 1192 |
| Presidio County, TX | 1,272 | 496 | 14.24% | 1091 |
| Pulaski County, IL | 830 | 272 | 29.57% | 585 |
| Quay County, NM | 1,287 | 475 | 44.76% | 711 |
| Reynolds County, MO | 882 | 268 | 49.22% | 448 |
| Richland Parish, LA | 3,434 | 1,134 | 46.93% | 1822 |
| Ripley County, MO | 2,187 | 702 | 21.50% | 1717 |
| Saguache County, CO | 1,052 | 354 | 42.45% | 605 |
| San Augustine County, TX | 1,182 | 394 | 16.62% | 986 |
| Shannon County, MO | 1,295 | 460 | 23.13% | 996 |
| Sharkey County, MS | 794 | 370 | 45.61% | 432 |
| Sharp County, AR | 2,575 | 838 | 40.04% | 1544 |
| Shelby County, TX | 4,673 | 1,415 | 13.39% | 4047 |
| Socorro County, NM | 2,717 | 921 | 5.71% | 2562 |
| St. Francis County, AR | 3,699 | 1,668 | 36.61% | 2345 |
| St. Helena Parish, LA | 1,565 | 577 | 29.34% | 1106 |
| Stone County, AR | 1,760 | 555 | 39.53% | 1064 |
| Summers County, WV | 1,528 | 528 | 49.26% | 775 |
| Sumter County, AL | 1,661 | 883 | 49.12% | 845 |
| Tensas Parish, LA | 760 | 336 | 0.00% | 760 |
| Thurston County, NE | 1,819 | 549 | 47.54% | 954 |
| Torrance County, NM | 2,371 | 750 | 46.55% | 1267 |
| Treutlen County, GA | 1,132 | 362 | 13.36% | 981 |
| Twiggs County, GA | 1,141 | 368 | 38.00% | 707 |
| Walthall County, MS | 2,449 | 855 | 21.86% | 1914 |
| Warren County, GA | 794 | 326 | 0.00% | 794 |
| Washington County, FL | 3,621 | 1,116 | 37.89% | 2249 |
| Wayne County, MO | 1,932 | 630 | 25.53% | 1439 |
| Webster County, GA | 381 | 129 | 46.91% | 202 |
| West Carroll Parish, LA | 1,876 | 612 | 45.36% | 1025 |
| Wheeler County, GA | 971 | 339 | 46.72% | 517 |
| Wheeler County, OR | 138 | 50 | 0.00% | 138 |
| Wilcox County, AL | 1,829 | 924 | 44.57% | 1014 |
| Woodruff County, AR | 1,024 | 358 | 42.74% | 586 |
| Wright County, MO | 3,267 | 1,227 | 44.46% | 1815 |
| Abbeville County, SC | 3,697 | 1,006 | 95.46% | 168 |
| Acadia Parish, LA | 11,494 | 3,917 | 72.88% | 3117 |
| Accomack County, VA | 4,751 | 1,223 | 58.54% | 1970 |
| Ada County, ID | 83,222 | 7,420 | 97.48% | 2096 |
| Adair County, IA | 1,119 | 131 | 79.78% | 226 |
| Adair County, KY | 2,676 | 900 | 77.71% | 597 |
| Adair County, MO | 3,258 | 607 | 74.25% | 839 |
| Adams County, CO | 98,094 | 11,824 | 96.32% | 3611 |
| Adams County, IA | 544 | 107 | 65.43% | 188 |
| Adams County, ID | 556 | 124 | 33.83% | 368 |
| Adams County, IL | 10,368 | 1,483 | 89.25% | 1115 |
| Adams County, IN | 7,673 | 1,722 | 83.81% | 1242 |
| Adams County, MS | 4,392 | 1,759 | 94.91% | 224 |
| Adams County, ND | 318 | 37 | 100.00% | - |
| Adams County, NE | 5,173 | 693 | 93.47% | 338 |
| Adams County, OH | 4,788 | 1,199 | 54.48% | 2180 |
| Adams County, PA | 14,954 | 1,417 | 93.99% | 899 |
| Adams County, WA | 5,047 | 941 | 41.17% | 2969 |
| Adams County, WI | 2,183 | 472 | 58.31% | 910 |
| Addison County, VT | 4,495 | 389 | 90.20% | 441 |
| Aiken County, SC | 26,734 | 5,859 | 91.25% | 2340 |
| Aitkin County, MN | 2,003 | 364 | 49.51% | 1011 |
| Alachua County, FL | 33,750 | 6,513 | 88.62% | 3839 |
| Alamance County, NC | 26,799 | 4,891 | 99.33% | 180 |
| Alameda County, CA | 242,905 | 22,809 | 98.96% | 2531 |
| Alamosa County, CO | 2,892 | 687 | 73.03% | 780 |
| Albany County, NY | 39,996 | 6,074 | 98.66% | 536 |
| Albany County, WY | 4,300 | 504 | 92.25% | 333 |
| Albemarle County, VA | 15,573 | 1,208 | 87.94% | 1878 |
| Alcona County, MI | 971 | 312 | 67.28% | 318 |
| Alcorn County, MS | 6,212 | 1,415 | 81.79% | 1131 |
| Aleutians East Borough, AK | 191 | 23 | 0.00% | 191 |
| Aleutians West Census Area, AK | 449 | 35 | 0.00% | 449 |
| Alexander County, NC | 5,558 | 1,044 | 89.75% | 570 |
| Alexandria city, VA | 17,278 | 2,982 | 99.51% | 84 |
| Alfalfa County, OK | 815 | 142 | 93.23% | 55 |
| Alger County, MI | 1,011 | 176 | 76.79% | 235 |
| Allamakee County, IA | 2,249 | 411 | 68.38% | 711 |
| Allegan County, MI | 20,561 | 2,577 | 74.30% | 5283 |
| Allegany County, MD | 8,809 | 1,624 | 88.16% | 1043 |
| Allegany County, NY | 6,714 | 1,399 | 74.08% | 1740 |
| Alleghany County, NC | 1,382 | 403 | 94.93% | 70 |
| Alleghany County, VA | 2,064 | 378 | 94.95% | 104 |
| Allegheny County, PA | 161,210 | 22,267 | 99.30% | 1136 |
| Allen County, IN | 68,272 | 12,569 | 95.92% | 2785 |
| Allen County, KS | 2,010 | 482 | 80.88% | 384 |
| Allen County, KY | 3,503 | 772 | 98.99% | 35 |
| Allen County, OH | 16,851 | 2,893 | 95.29% | 794 |
| Allen Parish, LA | 4,070 | 848 | 27.34% | 2957 |
| Allendale County, SC | 1,254 | 626 | 56.44% | 546 |
| Alpena County, MI | 3,769 | 726 | 92.22% | 293 |
| Alpine County, CA | 148 | 44 | 18.38% | 121 |
| Amador County, CA | 4,214 | 577 | 53.77% | 1948 |
| Amelia County, VA | 1,966 | 232 | 62.15% | 744 |
| Amherst County, VA | 4,456 | 762 | 70.63% | 1309 |
| Anchorage Borough, AK | 49,069 | 5,411 | 99.19% | 399 |
| Anderson County, KS | 1,445 | 226 | 22.02% | 1127 |
| Anderson County, KY | 3,833 | 541 | 84.89% | 579 |
| Anderson County, SC | 33,498 | 6,519 | 96.56% | 1151 |
| Anderson County, TN | 11,838 | 2,251 | 97.93% | 245 |
| Anderson County, TX | 7,977 | 1,630 | 53.57% | 3704 |
| Andrew County, MO | 2,960 | 324 | 90.62% | 278 |
| Andrews County, TX | 3,957 | 536 | 98.09% | 76 |
| Androscoggin County, ME | 16,363 | 2,665 | 99.81% | 31 |
| Angelina County, TX | 16,069 | 3,914 | 87.98% | 1931 |
| Anne Arundel County, MD | 91,272 | 8,072 | 97.94% | 1878 |
| Anoka County, MN | 60,775 | 4,248 | 99.02% | 597 |
| Anson County, NC | 3,542 | 1,034 | 86.53% | 477 |
| Antelope County, NE | 1,052 | 167 | 56.08% | 462 |
| Antrim County, MI | 3,067 | 529 | 89.59% | 319 |
| Appanoose County, IA | 2,003 | 421 | 76.39% | 473 |
| Appling County, GA | 3,229 | 1,020 | 54.73% | 1462 |
| Appomattox County, VA | 2,375 | 438 | 55.51% | 1057 |
| Aransas County, TX | 2,953 | 989 | 96.78% | 95 |
| Arapahoe County, CO | 111,175 | 10,413 | 98.30% | 1888 |
| Archer County, TX | 1,406 | 202 | 87.02% | 182 |
| Archuleta County, CO | 1,814 | 370 | 46.18% | 976 |
| Arenac County, MI | 1,943 | 435 | 59.12% | 794 |
| Arkansas County, AR | 2,822 | 665 | 14.85% | 2403 |
| Arlington County, VA | 28,282 | 2,094 | 99.39% | 172 |
| Armstrong County, PA | 9,059 | 1,185 | 93.92% | 551 |
| Armstrong County, TX | 323 | 47 | 55.87% | 143 |
| Aroostook County, ME | 8,532 | 1,534 | 87.00% | 1109 |
| Arthur County, NE | 95 | 15 | 76.52% | 22 |
| Ascension Parish, LA | 24,267 | 3,340 | 99.85% | 35 |
| Ashe County, NC | 3,598 | 840 | 93.24% | 243 |
| Ashland County, OH | 8,718 | 1,202 | 81.37% | 1624 |
| Ashland County, WI | 2,420 | 509 | 70.49% | 714 |
| Ashley County, AR | 3,267 | 936 | 43.78% | 1837 |
| Ashtabula County, OH | 15,496 | 3,500 | 92.81% | 1114 |
| Asotin County, WA | 3,345 | 615 | 94.83% | 173 |
| Assumption Parish, LA | 3,506 | 975 | 98.96% | 37 |
| Atascosa County, TX | 9,947 | 2,312 | 50.21% | 4952 |
| Atchison County, KS | 2,734 | 464 | 80.01% | 547 |
| Atchison County, MO | 775 | 116 | 79.12% | 162 |
| Athens County, OH | 6,807 | 1,652 | 79.83% | 1373 |
| Atkinson County, GA | 1,550 | 637 | 60.97% | 605 |
| Atlantic County, NJ | 41,331 | 7,530 | 97.53% | 1022 |
| Atoka County, OK | 2,238 | 603 | 29.62% | 1575 |
| Attala County, MS | 3,431 | 1,078 | 68.42% | 1083 |
| Audrain County, MO | 3,853 | 922 | 67.17% | 1265 |
| Audubon County, IA | 776 | 135 | 76.32% | 184 |
| Auglaize County, OH | 7,968 | 556 | 90.17% | 784 |
| Augusta County, VA | 10,645 | 1,088 | 79.61% | 2170 |
| Aurora County, SD | 458 | 60 | 69.34% | 140 |
| Austin County, TX | 5,257 | 817 | 63.18% | 1936 |
| Autauga County, AL | 9,677 | 1,891 | 89.89% | 979 |
| Avery County, NC | 1,864 | 454 | 77.63% | 417 |
| Baca County, CO | 599 | 165 | 52.22% | 286 |
| Bacon County, GA | 2,078 | 646 | 70.72% | 608 |
| Bailey County, TX | 1,598 | 385 | 78.05% | 351 |
| Baker County, FL | 4,823 | 1,009 | 83.95% | 774 |
| Baker County, OR | 2,234 | 464 | 74.54% | 569 |
| Baldwin County, AL | 34,508 | 4,534 | 91.51% | 2929 |
| Baldwin County, GA | 6,165 | 1,852 | 94.38% | 346 |
| Ballard County, KY | 1,264 | 279 | 100.00% | - |
| Baltimore city, MD | 83,050 | 22,635 | 97.58% | 2013 |
| Baltimore County, MD | 127,379 | 16,589 | 97.90% | 2676 |
| Bamberg County, SC | 2,013 | 747 | 67.21% | 660 |
| Bandera County, TX | 2,705 | 584 | 55.98% | 1191 |
| Banks County, GA | 3,054 | 571 | 75.13% | 760 |
| Banner County, NE | 123 | 30 | 0.00% | 123 |
| Bannock County, ID | 16,386 | 2,359 | 91.18% | 1446 |
| Baraga County, MI | 1,099 | 207 | 63.53% | 401 |
| Barber County, KS | 731 | 139 | 85.41% | 107 |
| Barbour County, AL | 3,848 | 1,411 | 78.62% | 823 |
| Barbour County, WV | 2,350 | 589 | 46.19% | 1265 |
| Barnes County, ND | 1,542 | 165 | 92.07% | 122 |
| Barnstable County, MA | 23,805 | 2,269 | 98.25% | 416 |
| Barnwell County, SC | 3,708 | 1,160 | 83.16% | 624 |
| Barren County, KY | 7,148 | 1,805 | 83.12% | 1207 |
| Barron County, WI | 7,078 | 1,027 | 68.58% | 2224 |
| Barrow County, GA | 15,188 | 2,192 | 99.35% | 99 |
| Barry County, MI | 9,854 | 941 | 55.17% | 4418 |
| Barry County, MO | 5,816 | 1,481 | 79.65% | 1184 |
| Bartholomew County, IN | 13,731 | 1,569 | 92.64% | 1011 |
| Barton County, KS | 4,404 | 767 | 92.22% | 342 |
| Barton County, MO | 2,022 | 403 | 57.01% | 869 |
| Bartow County, GA | 18,342 | 2,893 | 98.20% | 330 |
| Bastrop County, TX | 15,965 | 2,954 | 77.99% | 3513 |
| Bates County, MO | 2,740 | 513 | 54.51% | 1246 |
| Bath County, KY | 2,212 | 709 | 82.09% | 396 |
| Bath County, VA | 448 | 65 | 72.08% | 125 |
| Baxter County, AR | 5,320 | 1,153 | 79.54% | 1089 |
| Bay County, FL | 27,743 | 5,600 | 96.99% | 836 |
| Bay County, MI | 15,374 | 3,562 | 94.27% | 881 |
| Bayfield County, WI | 1,829 | 402 | 85.05% | 273 |
| Baylor County, TX | 604 | 160 | 99.76% | 1 |
| Beadle County, SD | 3,352 | 603 | 85.51% | 486 |
| Bear Lake County, ID | 1,204 | 164 | 83.04% | 204 |
| Beaufort County, NC | 7,048 | 1,846 | 88.94% | 780 |
| Beaufort County, SC | 24,997 | 4,917 | 87.89% | 3028 |
| Beauregard Parish, LA | 6,525 | 1,105 | 50.95% | 3200 |
| Beaver County, OK | 1,035 | 160 | 64.74% | 365 |
| Beaver County, PA | 23,198 | 3,644 | 98.38% | 375 |
| Beaver County, UT | 1,520 | 196 | 45.51% | 828 |
| Beaverhead County, MT | 1,098 | 177 | 79.83% | 221 |
| Becker County, MN | 6,083 | 869 | 92.51% | 456 |
| Beckham County, OK | 3,746 | 707 | 66.77% | 1245 |
| Bedford County, PA | 6,805 | 937 | 77.43% | 1536 |
| Bedford County, TN | 8,888 | 1,826 | 86.76% | 1177 |
| Bedford County, VA | 11,775 | 1,393 | 100.00% | - |
| Bee County, TX | 4,809 | 1,424 | 81.17% | 906 |
| Belknap County, NH | 8,276 | 842 | 98.26% | 144 |
| Bell County, KY | 3,983 | 1,718 | 98.58% | 57 |
| Bell County, TX | 67,351 | 12,592 | 95.90% | 2762 |
| Belmont County, OH | 9,122 | 1,472 | 85.68% | 1306 |
| Beltrami County, MN | 8,091 | 1,802 | 99.22% | 63 |
| Ben Hill County, GA | 3,016 | 1,144 | 90.98% | 272 |
| Benewah County, ID | 1,541 | 318 | 4.00% | 1479 |
| Bennett County, SD | 836 | 351 | 90.56% | 79 |
| Bennington County, VT | 4,885 | 684 | 95.13% | 238 |
| Bent County, CO | 681 | 197 | 56.36% | 297 |
| Benton County, AR | 51,528 | 5,673 | 93.50% | 3348 |
| Benton County, IA | 4,313 | 348 | 81.34% | 805 |
| Benton County, IN | 1,556 | 254 | 10.19% | 1397 |
| Benton County, MN | 7,113 | 852 | 89.73% | 730 |
| Benton County, MS | 1,290 | 403 | 58.55% | 535 |
| Benton County, OR | 10,907 | 1,077 | 92.17% | 854 |
| Benton County, TN | 2,365 | 672 | 37.51% | 1478 |
| Benton County, WA | 38,942 | 4,947 | 94.02% | 2329 |
| Benzie County, MI | 2,320 | 329 | 74.56% | 590 |
| Bergen County, NJ | 147,951 | 11,702 | 99.99% | 18 |
| Berkeley County, SC | 37,752 | 6,691 | 94.07% | 2237 |
| Berkeley County, WV | 19,393 | 2,784 | 95.08% | 954 |
| Berks County, PA | 67,990 | 10,664 | 98.01% | 1355 |
| Berkshire County, MA | 15,271 | 2,314 | 92.59% | 1132 |
| Bernalillo County, NM | 106,433 | 22,898 | 97.53% | 2627 |
| Berrien County, GA | 3,347 | 998 | 84.37% | 523 |
| Berrien County, MI | 24,045 | 4,423 | 92.92% | 1702 |
| Bertie County, NC | 2,470 | 750 | 81.45% | 458 |
| Bexar County, TX | 360,303 | 79,225 | 98.53% | 5288 |
| Bibb County, AL | 3,199 | 840 | 42.28% | 1847 |
| Bibb County, GA | 26,458 | 9,558 | 97.81% | 579 |
| Big Horn County, WY | 2,243 | 344 | 54.58% | 1019 |
| Big Stone County, MN | 752 | 121 | 92.79% | 54 |
| Billings County, ND | 117 | 14 | 64.75% | 41 |
| Bingham County, ID | 10,657 | 1,519 | 73.71% | 2802 |
| Black Hawk County, IA | 19,946 | 3,523 | 98.86% | 227 |
| Blackford County, IN | 1,866 | 394 | 87.45% | 234 |
| Bladen County, NC | 4,979 | 2,079 | 73.06% | 1341 |
| Blaine County, ID | 3,868 | 272 | 84.56% | 597 |
| Blaine County, MT | 1,388 | 335 | 96.89% | 43 |
| Blaine County, NE | 65 | 15 | 39.12% | 40 |
| Blaine County, OK | 1,744 | 390 | 70.83% | 509 |
| Blair County, PA | 18,160 | 3,358 | 94.02% | 1087 |
| Blanco County, TX | 1,591 | 252 | 25.25% | 1189 |
| Bland County, VA | 704 | 94 | 100.00% | - |
| Bleckley County, GA | 1,849 | 534 | 43.56% | 1044 |
| Blount County, AL | 9,785 | 1,520 | 74.20% | 2524 |
| Blount County, TN | 19,517 | 2,495 | 98.81% | 233 |
| Blue Earth County, MN | 9,321 | 909 | 77.11% | 2133 |
| Boise County, ID | 961 | 160 | 24.25% | 728 |
| Bolivar County, MS | 5,502 | 2,007 | 82.59% | 958 |
| Bollinger County, MO | 1,922 | 379 | 0.82% | 1906 |
| Bon Homme County, SD | 938 | 168 | 66.78% | 312 |
| Bond County, IL | 2,380 | 383 | 51.09% | 1164 |
| Bonner County, ID | 6,391 | 1,036 | 46.94% | 3391 |
| Bonneville County, ID | 25,793 | 3,065 | 93.97% | 1556 |
| Boone County, AR | 6,049 | 1,207 | 78.35% | 1310 |
| Boone County, IA | 3,908 | 351 | 89.63% | 405 |
| Boone County, IL | 10,111 | 1,165 | 91.65% | 844 |
| Boone County, IN | 12,919 | 584 | 86.43% | 1753 |
| Boone County, KY | 25,054 | 1,952 | 99.35% | 163 |
| Boone County, MO | 25,250 | 3,067 | 93.89% | 1543 |
| Boone County, NE | 876 | 110 | 55.64% | 389 |
| Boone County, WV | 3,463 | 857 | 87.69% | 426 |
| Borden County, TX | 98 | 15 | 30.73% | 68 |
| Bosque County, TX | 2,960 | 707 | 34.79% | 1930 |
| Bossier Parish, LA | 22,387 | 4,071 | 93.13% | 1538 |
| Botetourt County, VA | 4,757 | 360 | 78.55% | 1020 |
| Bottineau County, ND | 983 | 138 | 92.67% | 72 |
| Boulder County, CO | 47,022 | 2,889 | 93.65% | 2984 |
| Boundary County, ID | 2,010 | 441 | 26.90% | 1469 |
| Bourbon County, KS | 2,660 | 567 | 75.43% | 654 |
| Bourbon County, KY | 3,310 | 719 | 86.56% | 445 |
| Bowie County, TX | 16,048 | 3,774 | 91.48% | 1368 |
| Bowman County, ND | 569 | 49 | 100.00% | - |
| Box Butte County, NE | 1,931 | 292 | 94.21% | 112 |
| Box Elder County, UT | 12,687 | 1,097 | 84.63% | 1950 |
| Boyd County, KY | 7,084 | 1,856 | 95.85% | 294 |
| Boyd County, NE | 263 | 63 | 99.24% | 2 |
| Boyle County, KY | 4,219 | 817 | 84.90% | 637 |
| Bracken County, KY | 1,387 | 279 | 78.03% | 305 |
| Bradford County, FL | 3,858 | 951 | 33.86% | 2552 |
| Bradford County, PA | 9,531 | 1,535 | 69.10% | 2945 |
| Bradley County, AR | 1,926 | 540 | 62.82% | 716 |
| Bradley County, TN | 16,776 | 3,254 | 98.16% | 308 |
| Branch County, MI | 7,232 | 1,376 | 64.25% | 2585 |
| Brantley County, GA | 3,202 | 902 | 99.97% | 1 |
| Braxton County, WV | 1,989 | 542 | 46.61% | 1062 |
| Brazoria County, TX | 70,982 | 9,122 | 88.04% | 8488 |
| Brazos County, TX | 32,197 | 6,164 | 89.11% | 3508 |
| Breathitt County, KY | 1,697 | 750 | 61.23% | 658 |
| Breckinridge County, KY | 3,287 | 744 | 85.25% | 485 |
| Bremer County, IA | 4,014 | 239 | 96.60% | 137 |
| Brevard County, FL | 79,359 | 12,099 | 99.94% | 48 |
| Brewster County, TX | 1,237 | 255 | 69.05% | 383 |
| Briscoe County, TX | 214 | 50 | 73.73% | 56 |
| Bristol Bay Borough, AK | 107 | 18 | 0.00% | 107 |
| Bristol city, VA | 2,398 | 737 | 100.00% | - |
| Bristol County, MA | 85,046 | 10,743 | 98.61% | 1179 |
| Bristol County, RI | 7,035 | 443 | 99.97% | 2 |
| Broadwater County, MT | 892 | 126 | 10.74% | 796 |
| Bronx County, NY | 246,488 | 89,883 | 99.17% | 2057 |
| Brooke County, WV | 2,875 | 541 | 87.69% | 354 |
| Brookings County, SD | 4,908 | 409 | 97.86% | 105 |
| Brooks County, GA | 2,406 | 802 | 79.99% | 482 |
| Brooks County, TX | 1,417 | 704 | 88.95% | 157 |
| Broome County, NY | 26,093 | 5,919 | 98.25% | 456 |
| Broomfield County, CO | 12,185 | 600 | 96.41% | 437 |
| Broward County, FL | 296,062 | 49,360 | 99.27% | 2150 |
| Brown County, IL | 727 | 104 | 49.78% | 365 |
| Brown County, IN | 2,080 | 304 | 74.47% | 531 |
| Brown County, KS | 1,749 | 327 | 74.17% | 452 |
| Brown County, MN | 3,999 | 381 | 92.30% | 308 |
| Brown County, NE | 491 | 70 | 82.73% | 85 |
| Brown County, OH | 7,238 | 1,263 | 67.68% | 2339 |
| Brown County, SD | 6,593 | 698 | 90.70% | 613 |
| Brown County, TX | 5,947 | 1,202 | 2.50% | 5798 |
| Brown County, WI | 44,715 | 4,531 | 95.71% | 1917 |
| Brule County, SD | 973 | 172 | 100.00% | - |
| Brunswick County, NC | 15,085 | 2,861 | 94.17% | 879 |
| Brunswick County, VA | 1,954 | 489 | 26.83% | 1430 |
| Bryan County, GA | 8,185 | 894 | 97.83% | 177 |
| Bryan County, OK | 7,743 | 1,524 | 67.16% | 2543 |
| Buchanan County, IA | 3,949 | 548 | 75.14% | 982 |
| Buchanan County, MO | 13,805 | 2,824 | 94.66% | 737 |
| Buchanan County, VA | 2,614 | 747 | 100.00% | - |
| Buckingham County, VA | 2,251 | 507 | 40.58% | 1338 |
| Bucks County, PA | 95,881 | 5,709 | 98.68% | 1263 |
| Buena Vista city, VA | 908 | 151 | 98.69% | 12 |
| Buena Vista County, IA | 3,439 | 439 | 77.44% | 776 |
| Buffalo County, NE | 7,839 | 801 | 88.85% | 874 |
| Buffalo County, SD | 544 | 274 | 100.00% | - |
| Buffalo County, WI | 1,967 | 227 | 76.24% | 467 |
| Bullitt County, KY | 13,027 | 1,516 | 99.39% | 80 |
| Bulloch County, GA | 10,701 | 2,587 | 100.00% | - |
| Bullock County, AL | 1,511 | 1,005 | 88.23% | 178 |
| Buncombe County, NC | 33,776 | 5,599 | 99.48% | 175 |
| Bureau County, IL | 5,179 | 796 | 71.34% | 1484 |
| Burke County, GA | 4,206 | 1,286 | 73.31% | 1122 |
| Burke County, NC | 12,031 | 2,399 | 97.58% | 292 |
| Burke County, ND | 344 | 36 | 57.22% | 147 |
| Burleigh County, ND | 15,522 | 969 | 99.43% | 88 |
| Burleson County, TX | 2,887 | 645 | 1.93% | 2831 |
| Burlington County, NJ | 68,955 | 4,995 | 97.70% | 1583 |
| Burnet County, TX | 7,415 | 1,281 | 56.75% | 3207 |
| Burnett County, WI | 1,950 | 351 | 52.77% | 921 |
| Burt County, NE | 1,073 | 133 | 75.20% | 266 |
| Butler County, AL | 3,202 | 1,131 | 79.08% | 670 |
| Butler County, IA | 2,449 | 239 | 81.84% | 445 |
| Butler County, KS | 12,675 | 1,313 | 75.26% | 3136 |
| Butler County, KY | 1,980 | 440 | 53.82% | 914 |
| Butler County, MO | 7,036 | 1,967 | 68.82% | 2194 |
| Butler County, NE | 1,380 | 130 | 63.80% | 500 |
| Butler County, OH | 65,422 | 9,232 | 99.17% | 545 |
| Butler County, PA | 27,072 | 2,206 | 96.63% | 912 |
| Butte County, CA | 32,693 | 5,847 | 90.64% | 3061 |
| Butte County, ID | 483 | 77 | 36.80% | 305 |
| Butte County, SD | 1,798 | 312 | 95.88% | 74 |
| Butts County, GA | 3,553 | 1,089 | 93.01% | 248 |
| Cabarrus County, NC | 39,540 | 4,325 | 99.55% | 180 |
| Cabell County, WV | 12,879 | 2,936 | 94.85% | 663 |
| Cache County, UT | 27,426 | 2,699 | 93.44% | 1800 |
| Caddo County, OK | 5,180 | 1,302 | 67.37% | 1690 |
| Caddo Parish, LA | 40,790 | 14,922 | 96.74% | 1328 |
| Calaveras County, CA | 5,534 | 922 | 74.96% | 1386 |
| Calcasieu Parish, LA | 35,548 | 7,242 | 92.71% | 2591 |
| Caldwell County, KY | 2,039 | 507 | 76.95% | 470 |
| Caldwell County, MO | 1,600 | 283 | 46.86% | 850 |
| Caldwell County, NC | 11,952 | 2,424 | 97.98% | 242 |
| Caldwell County, TX | 6,967 | 1,463 | 76.15% | 1661 |
| Caldwell Parish, LA | 1,657 | 461 | 55.88% | 731 |
| Caledonia County, VT | 4,176 | 586 | 82.57% | 728 |
| Calhoun County, AL | 17,679 | 4,265 | 95.06% | 873 |
| Calhoun County, AR | 753 | 147 | 6.87% | 701 |
| Calhoun County, FL | 2,186 | 596 | 70.83% | 638 |
| Calhoun County, IA | 1,510 | 217 | 80.18% | 299 |
| Calhoun County, IL | 739 | 102 | 0.00% | 739 |
| Calhoun County, MI | 21,521 | 5,416 | 79.92% | 4321 |
| Calhoun County, MS | 2,531 | 821 | 82.04% | 455 |
| Calhoun County, SC | 2,067 | 548 | 74.02% | 537 |
| Calhoun County, TX | 3,734 | 846 | 86.32% | 511 |
| Calhoun County, WV | 981 | 269 | 29.24% | 694 |
| Callahan County, TX | 2,258 | 440 | 62.36% | 850 |
| Callaway County, MO | 6,560 | 990 | 95.37% | 304 |
| Calloway County, KY | 4,916 | 1,089 | 99.27% | 36 |
| Calumet County, WI | 9,104 | 510 | 86.74% | 1207 |
| Calvert County, MD | 16,110 | 970 | 98.34% | 268 |
| Camas County, ID | 209 | 26 | 0.00% | 209 |
| Cambria County, PA | 18,244 | 3,961 | 90.91% | 1659 |
| Camden County, GA | 9,040 | 1,779 | 95.71% | 388 |
| Camden County, MO | 5,782 | 1,238 | 74.51% | 1474 |
| Camden County, NC | 1,847 | 166 | 97.99% | 37 |
| Camden County, NJ | 83,053 | 14,125 | 98.34% | 1375 |
| Cameron County, PA | 550 | 126 | 92.96% | 39 |
| Cameron County, TX | 92,947 | 35,778 | 94.20% | 5396 |
| Cameron Parish, LA | 1,170 | 212 | 13.99% | 1006 |
| Camp County, TX | 2,448 | 738 | 51.37% | 1191 |
| Campbell County, KY | 13,507 | 1,885 | 99.31% | 93 |
| Campbell County, SD | 152 | 21 | 75.99% | 36 |
| Campbell County, TN | 5,830 | 1,513 | 88.88% | 648 |
| Campbell County, VA | 7,860 | 1,199 | 80.53% | 1531 |
| Campbell County, WY | 8,932 | 891 | 78.18% | 1949 |
| Canadian County, OK | 27,347 | 2,284 | 92.14% | 2149 |
| Candler County, GA | 2,000 | 673 | 100.00% | - |
| Cannon County, TN | 2,195 | 437 | 99.68% | 7 |
| Canyon County, ID | 45,974 | 6,238 | 88.65% | 5220 |
| Cape Girardeau County, MO | 11,904 | 1,903 | 81.32% | 2224 |
| Cape May County, NJ | 11,727 | 1,796 | 98.49% | 177 |
| Carbon County, MT | 1,460 | 195 | 34.88% | 951 |
| Carbon County, PA | 8,991 | 1,504 | 97.01% | 269 |
| Carbon County, UT | 3,894 | 595 | 94.95% | 197 |
| Carbon County, WY | 2,423 | 329 | 75.33% | 598 |
| Caribou County, ID | 1,523 | 155 | 73.82% | 399 |
| Carlisle County, KY | 750 | 160 | 94.42% | 42 |
| Carlton County, MN | 5,949 | 571 | 79.52% | 1218 |
| Caroline County, MD | 5,699 | 1,062 | 80.81% | 1093 |
| Caroline County, VA | 4,932 | 707 | 66.25% | 1665 |
| Carroll County, AR | 4,305 | 1,046 | 70.96% | 1250 |
| Carroll County, GA | 19,937 | 4,448 | 93.45% | 1305 |
| Carroll County, IA | 3,511 | 300 | 85.58% | 506 |
| Carroll County, IL | 1,977 | 308 | 76.71% | 460 |
| Carroll County, IN | 3,251 | 347 | 63.23% | 1196 |
| Carroll County, KY | 1,916 | 466 | 75.13% | 477 |
| Carroll County, MD | 26,990 | 1,528 | 95.75% | 1148 |
| Carroll County, MO | 1,464 | 279 | 69.22% | 451 |
| Carroll County, MS | 1,405 | 308 | 31.41% | 964 |
| Carroll County, NH | 5,675 | 757 | 96.32% | 209 |
| Carroll County, OH | 4,185 | 652 | 56.98% | 1800 |
| Carroll County, TN | 4,345 | 1,190 | 69.25% | 1336 |
| Carroll County, VA | 3,964 | 803 | 68.82% | 1236 |
| Carson City, NV | 7,927 | 1,209 | 98.67% | 106 |
| Carson County, TX | 1,116 | 118 | 63.35% | 409 |
| Carter County, KY | 4,217 | 1,375 | 78.20% | 919 |
| Carter County, MT | 154 | 35 | 51.38% | 75 |
| Carter County, OK | 8,592 | 1,857 | 71.41% | 2456 |
| Carter County, TN | 7,638 | 2,193 | 97.42% | 197 |
| Carteret County, NC | 9,084 | 1,406 | 99.91% | 9 |
| Carver County, MN | 20,695 | 627 | 91.61% | 1736 |
| Cascade County, MT | 12,439 | 1,847 | 88.84% | 1388 |
| Casey County, KY | 2,521 | 963 | 92.35% | 193 |
| Cass County, IA | 2,150 | 341 | 93.26% | 145 |
| Cass County, IL | 2,032 | 303 | 76.00% | 488 |
| Cass County, IN | 6,051 | 969 | 73.26% | 1618 |
| Cass County, MI | 7,911 | 1,261 | 96.62% | 267 |
| Cass County, MN | 4,472 | 834 | 77.95% | 986 |
| Cass County, MO | 18,485 | 1,862 | 76.54% | 4336 |
| Cass County, ND | 27,563 | 2,078 | 96.44% | 982 |
| Cass County, NE | 4,608 | 402 | 78.69% | 982 |
| Cass County, TX | 4,923 | 1,670 | 54.27% | 2251 |
| Cassia County, ID | 5,609 | 856 | 64.31% | 2002 |
| Castro County, TX | 1,614 | 371 | 61.93% | 614 |
| Caswell County, NC | 3,094 | 821 | 64.24% | 1107 |
| Catawba County, NC | 25,443 | 4,754 | 99.39% | 156 |
| Catoosa County, GA | 11,499 | 1,676 | 99.18% | 95 |
| Cattaraugus County, NY | 12,243 | 2,757 | 80.57% | 2379 |
| Cavalier County, ND | 584 | 76 | 100.00% | - |
| Cayuga County, NY | 10,782 | 1,805 | 81.85% | 1957 |
| Cecil County, MD | 17,018 | 1,789 | 96.27% | 634 |
| Cedar County, IA | 3,034 | 252 | 78.55% | 651 |
| Cedar County, MO | 2,352 | 710 | 50.54% | 1163 |
| Cedar County, NE | 1,564 | 175 | 71.75% | 442 |
| Centre County, PA | 17,821 | 1,651 | 89.29% | 1908 |
| Cerro Gordo County, IA | 6,273 | 770 | 94.24% | 361 |
| Chaffee County, CO | 2,214 | 289 | 70.51% | 653 |
| Chambers County, AL | 4,969 | 1,506 | 82.25% | 882 |
| Chambers County, TX | 8,786 | 887 | 65.08% | 3068 |
| Champaign County, IL | 27,080 | 4,640 | 94.04% | 1614 |
| Champaign County, OH | 6,337 | 846 | 82.98% | 1078 |
| Chariton County, MO | 1,220 | 227 | 51.59% | 591 |
| Charles City County, VA | 778 | 138 | 0.00% | 778 |
| Charles County, MD | 28,593 | 2,503 | 94.10% | 1687 |
| Charles Mix County, SD | 1,841 | 500 | 34.86% | 1199 |
| Charleston County, SC | 55,323 | 13,547 | 96.59% | 1884 |
| Charlevoix County, MI | 3,729 | 522 | 82.61% | 649 |
| Charlotte County, FL | 16,162 | 3,080 | 94.36% | 911 |
| Charlotte County, VA | 1,789 | 517 | 30.13% | 1250 |
| Charlottesville city, VA | 4,755 | 946 | 99.30% | 33 |
| Charlton County, GA | 1,780 | 500 | 68.81% | 555 |
| Chase County, KS | 378 | 45 | 7.53% | 350 |
| Chase County, NE | 744 | 76 | 71.31% | 213 |
| Chatham County, GA | 41,947 | 8,289 | 98.20% | 756 |
| Chatham County, NC | 10,976 | 1,442 | 82.71% | 1897 |
| Chattahoochee County, GA | 1,411 | 295 | 72.38% | 390 |
| Chattooga County, GA | 3,971 | 853 | 94.19% | 231 |
| Chautauqua County, KS | 471 | 120 | 16.76% | 392 |
| Chautauqua County, NY | 18,461 | 4,551 | 92.57% | 1372 |
| Chaves County, NM | 12,203 | 2,712 | 86.04% | 1703 |
| Cheatham County, TN | 6,496 | 770 | 95.98% | 261 |
| Cheboygan County, MI | 3,016 | 726 | 60.42% | 1194 |
| Chelan County, WA | 12,927 | 1,870 | 92.09% | 1022 |
| Chemung County, NY | 12,879 | 2,320 | 95.27% | 609 |
| Chenango County, NY | 7,002 | 1,417 | 81.96% | 1263 |
| Cherokee County, AL | 3,732 | 830 | 50.64% | 1842 |
| Cherokee County, GA | 46,243 | 4,110 | 98.41% | 733 |
| Cherokee County, IA | 1,761 | 186 | 74.63% | 447 |
| Cherokee County, KS | 3,348 | 694 | 86.99% | 436 |
| Cherokee County, NC | 3,487 | 901 | 73.86% | 912 |
| Cherokee County, OK | 7,629 | 1,834 | 65.93% | 2599 |
| Cherokee County, SC | 9,628 | 2,052 | 90.67% | 898 |
| Cherokee County, TX | 9,522 | 2,291 | 43.02% | 5426 |
| Cherry County, NE | 923 | 137 | 62.63% | 345 |
| Chesapeake city, VA | 42,394 | 4,525 | 98.73% | 537 |
| Cheshire County, NH | 9,957 | 1,125 | 80.47% | 1945 |
| Chester County, PA | 87,886 | 6,211 | 98.91% | 954 |
| Chester County, SC | 5,343 | 1,606 | 76.00% | 1283 |
| Chester County, TN | 2,789 | 569 | 50.72% | 1375 |
| Chesterfield County, SC | 7,324 | 2,185 | 48.21% | 3793 |
| Chesterfield County, VA | 60,638 | 5,301 | 98.30% | 1030 |
| Cheyenne County, CO | 325 | 67 | 72.93% | 88 |
| Cheyenne County, KS | 376 | 76 | 7.70% | 347 |
| Cheyenne County, NE | 1,566 | 188 | 70.53% | 461 |
| Chickasaw County, IA | 2,042 | 226 | 69.75% | 618 |
| Chickasaw County, MS | 3,109 | 811 | 56.12% | 1364 |
| Chicot County, AR | 1,700 | 695 | 54.42% | 775 |
| Childress County, TX | 1,060 | 244 | 95.21% | 51 |
| Chilton County, AL | 7,621 | 1,730 | 78.38% | 1647 |
| Chippewa County, MI | 4,955 | 1,004 | 78.59% | 1061 |
| Chippewa County, MN | 1,947 | 258 | 70.52% | 574 |
| Chippewa County, WI | 10,317 | 1,347 | 85.08% | 1539 |
| Chisago County, MN | 9,273 | 601 | 77.48% | 2088 |
| Chittenden County, VT | 20,866 | 1,618 | 97.97% | 423 |
| Choctaw County, AL | 1,873 | 546 | 28.50% | 1339 |
| Choctaw County, MS | 1,314 | 382 | 63.09% | 485 |
| Choctaw County, OK | 2,513 | 749 | 0.00% | 2513 |
| Chouteau County, MT | 1,010 | 209 | 98.42% | 16 |
| Chowan County, NC | 2,108 | 595 | 91.56% | 178 |
| Christian County, IL | 4,786 | 750 | 84.72% | 731 |
| Christian County, KY | 12,057 | 3,358 | 93.26% | 813 |
| Christian County, MO | 16,089 | 1,700 | 88.56% | 1841 |
| Churchill County, NV | 3,851 | 661 | 90.98% | 348 |
| Cimarron County, OK | 390 | 101 | 72.65% | 107 |
| Citrus County, FL | 15,839 | 3,370 | 95.14% | 770 |
| Clackamas County, OR | 65,845 | 4,868 | 96.28% | 2447 |
| Claiborne County, MS | 1,337 | 611 | 71.95% | 375 |
| Claiborne County, TN | 4,345 | 1,265 | 93.70% | 274 |
| Claiborne Parish, LA | 2,011 | 836 | 59.09% | 823 |
| Clallam County, WA | 9,201 | 1,827 | 84.14% | 1459 |
| Clare County, MI | 4,295 | 1,307 | 74.75% | 1084 |
| Clarendon County, SC | 4,805 | 1,713 | 93.67% | 304 |
| Clarion County, PA | 5,080 | 879 | 84.92% | 766 |
| Clark County, AR | 2,956 | 743 | 77.30% | 671 |
| Clark County, ID | 148 | 28 | 95.11% | 7 |
| Clark County, IL | 2,555 | 391 | 71.83% | 720 |
| Clark County, IN | 18,521 | 2,556 | 95.44% | 844 |
| Clark County, KS | 360 | 64 | 43.39% | 204 |
| Clark County, KY | 5,738 | 1,372 | 93.16% | 392 |
| Clark County, MO | 1,098 | 249 | 39.91% | 660 |
| Clark County, NV | 369,586 | 69,084 | 97.46% | 9387 |
| Clark County, OH | 21,483 | 4,240 | 99.41% | 128 |
| Clark County, SD | 464 | 94 | 77.00% | 107 |
| Clark County, WA | 84,338 | 7,871 | 96.38% | 3050 |
| Clark County, WI | 7,210 | 1,273 | 48.73% | 3697 |
| Clarke County, AL | 3,776 | 1,185 | 73.87% | 986 |
| Clarke County, GA | 15,046 | 4,237 | 99.98% | 3 |
| Clarke County, IA | 1,707 | 255 | 83.41% | 283 |
| Clarke County, MS | 2,536 | 815 | 67.49% | 824 |
| Clarke County, VA | 2,136 | 150 | 63.62% | 777 |
| Clatsop County, OR | 5,347 | 816 | 84.79% | 813 |
| Clay County, AL | 1,971 | 493 | 43.25% | 1118 |
| Clay County, AR | 2,241 | 610 | 64.94% | 786 |
| Clay County, FL | 37,581 | 4,061 | 96.31% | 1387 |
| Clay County, GA | 433 | 185 | 66.13% | 147 |
| Clay County, IA | 2,603 | 278 | 85.55% | 376 |
| Clay County, IL | 2,177 | 384 | 86.46% | 295 |
| Clay County, IN | 4,248 | 892 | 75.69% | 1033 |
| Clay County, KS | 1,323 | 218 | 92.84% | 95 |
| Clay County, KY | 2,840 | 1,279 | 94.62% | 153 |
| Clay County, MN | 10,827 | 1,414 | 94.76% | 567 |
| Clay County, MO | 42,660 | 3,352 | 97.14% | 1221 |
| Clay County, MS | 3,258 | 1,063 | 67.36% | 1063 |
| Clay County, NC | 1,398 | 286 | 61.63% | 536 |
| Clay County, NE | 1,063 | 149 | 64.93% | 373 |
| Clay County, SD | 1,691 | 242 | 78.14% | 370 |
| Clay County, TN | 1,170 | 335 | 95.39% | 54 |
| Clay County, TX | 1,587 | 248 | 17.21% | 1314 |
| Clayton County, GA | 57,532 | 16,053 | 99.51% | 284 |
| Clayton County, IA | 2,659 | 319 | 71.42% | 760 |
| Clear Creek County, CO | 1,062 | 100 | 80.03% | 212 |
| Clearfield County, PA | 10,502 | 2,305 | 82.84% | 1802 |
| Clearwater County, ID | 1,026 | 220 | 0.00% | 1026 |
| Clearwater County, MN | 1,608 | 263 | 99.85% | 2 |
| Cleburne County, AL | 2,462 | 563 | 11.97% | 2167 |
| Cleburne County, AR | 3,569 | 776 | 53.65% | 1654 |
| Clermont County, OH | 34,753 | 3,223 | 99.40% | 207 |
| Cleveland County, AR | 1,328 | 244 | 84.08% | 211 |
| Cleveland County, NC | 15,599 | 4,226 | 96.08% | 611 |
| Cleveland County, OK | 44,528 | 4,985 | 95.31% | 2090 |
| Clinch County, GA | 1,237 | 419 | 54.96% | 557 |
| Clinton County, IA | 7,600 | 1,163 | 96.11% | 296 |
| Clinton County, IL | 5,624 | 570 | 74.61% | 1428 |
| Clinton County, IN | 6,016 | 861 | 76.41% | 1419 |
| Clinton County, KY | 1,587 | 570 | 93.92% | 97 |
| Clinton County, MI | 12,959 | 940 | 63.00% | 4795 |
| Clinton County, MO | 3,482 | 423 | 71.02% | 1009 |
| Clinton County, NY | 10,226 | 1,646 | 92.55% | 762 |
| Clinton County, OH | 6,977 | 1,077 | 75.51% | 1709 |
| Clinton County, PA | 5,574 | 929 | 91.13% | 494 |
| Cloud County, KS | 1,409 | 231 | 93.18% | 96 |
| Coahoma County, MS | 4,250 | 2,094 | 80.81% | 816 |
| Coal County, OK | 928 | 262 | 41.82% | 540 |
| Cobb County, GA | 129,421 | 17,275 | 98.66% | 1741 |
| Cochise County, AZ | 19,476 | 4,527 | 69.53% | 5935 |
| Cochran County, TX | 543 | 164 | 66.97% | 179 |
| Cocke County, TN | 5,266 | 1,878 | 81.21% | 990 |
| Coconino County, AZ | 21,203 | 3,743 | 64.98% | 7425 |
| Codington County, SD | 4,889 | 514 | 87.35% | 618 |
| Coffee County, AL | 8,925 | 1,794 | 89.84% | 907 |
| Coffee County, GA | 7,391 | 2,514 | 89.48% | 778 |
| Coffee County, TN | 9,599 | 2,287 | 84.70% | 1469 |
| Coffey County, KS | 1,282 | 155 | 64.02% | 461 |
| Coke County, TX | 501 | 103 | 73.64% | 132 |
| Colbert County, AL | 8,110 | 1,567 | 88.65% | 921 |
| Cole County, MO | 12,257 | 1,376 | 89.54% | 1282 |
| Coleman County, TX | 1,284 | 362 | 26.17% | 948 |
| Coles County, IL | 6,487 | 1,327 | 84.28% | 1020 |
| Colfax County, NE | 2,191 | 269 | 21.87% | 1712 |
| Colfax County, NM | 1,567 | 430 | 10.19% | 1407 |
| Colleton County, SC | 6,080 | 2,022 | 88.13% | 722 |
| Collier County, FL | 47,235 | 8,219 | 98.51% | 704 |
| Collin County, TX | 196,469 | 12,463 | 97.65% | 4608 |
| Collingsworth County, TX | 596 | 141 | 58.75% | 246 |
| Colonial Heights city, VA | 2,967 | 503 | 98.51% | 44 |
| Colorado County, TX | 3,429 | 725 | 62.42% | 1289 |
| Colquitt County, GA | 8,630 | 2,922 | 88.63% | 982 |
| Columbia County, AR | 3,379 | 918 | 70.19% | 1007 |
| Columbia County, FL | 10,856 | 2,785 | 84.52% | 1681 |
| Columbia County, GA | 28,998 | 2,946 | 92.84% | 2076 |
| Columbia County, NY | 7,402 | 1,032 | 82.46% | 1299 |
| Columbia County, OR | 7,992 | 954 | 76.88% | 1848 |
| Columbia County, PA | 8,362 | 1,049 | 78.96% | 1759 |
| Columbia County, WA | 546 | 98 | 97.08% | 16 |
| Columbia County, WI | 8,831 | 774 | 69.03% | 2735 |
| Columbiana County, OH | 15,094 | 3,174 | 83.60% | 2476 |
| Columbus County, NC | 8,509 | 2,892 | 82.55% | 1485 |
| Colusa County, CA | 4,294 | 588 | 34.93% | 2794 |
| Comal County, TX | 24,638 | 2,415 | 95.93% | 1003 |
| Comanche County, KS | 306 | 37 | 65.47% | 106 |
| Comanche County, OK | 19,404 | 4,643 | 86.65% | 2591 |
| Comanche County, TX | 2,188 | 511 | 47.16% | 1156 |
| Concho County, TX | 383 | 92 | 8.37% | 351 |
| Concordia Parish, LA | 3,419 | 1,203 | 67.51% | 1111 |
| Conejos County, CO | 1,576 | 419 | 40.01% | 945 |
| Contra Costa County, CA | 192,550 | 15,331 | 99.41% | 1129 |
| Converse County, WY | 2,440 | 253 | 80.31% | 480 |
| Conway County, AR | 3,359 | 809 | 55.83% | 1484 |
| Cook County, GA | 3,143 | 1,033 | 84.82% | 477 |
| Cook County, IL | 801,709 | 148,541 | 99.43% | 4544 |
| Cook County, MN | 579 | 73 | 98.98% | 6 |
| Cooke County, TX | 6,587 | 1,666 | 78.45% | 1419 |
| Cooper County, MO | 2,707 | 481 | 100.00% | - |
| Coos County, NH | 3,645 | 704 | 82.05% | 654 |
| Coos County, OR | 8,256 | 1,833 | 89.45% | 871 |
| Coosa County, AL | 1,264 | 385 | 81.33% | 236 |
| Copiah County, MS | 4,768 | 1,677 | 84.73% | 728 |
| Corson County, SD | 1,096 | 402 | 82.81% | 188 |
| Cortland County, NY | 6,470 | 1,030 | 88.68% | 733 |
| Coryell County, TX | 11,797 | 2,240 | 75.74% | 2862 |
| Coshocton County, OH | 6,126 | 1,394 | 68.83% | 1909 |
| Costilla County, CO | 543 | 189 | 62.43% | 204 |
| Cottle County, TX | 244 | 87 | 86.98% | 32 |
| Cotton County, OK | 955 | 198 | 78.17% | 208 |
| Cottonwood County, MN | 1,940 | 295 | 71.83% | 546 |
| Covington city, VA | 822 | 169 | 99.68% | 3 |
| Covington County, AL | 5,774 | 1,745 | 85.04% | 864 |
| Covington County, MS | 3,372 | 1,082 | 60.55% | 1330 |
| Coweta County, GA | 26,623 | 3,562 | 98.42% | 420 |
| Cowley County, KS | 5,933 | 1,148 | 84.14% | 941 |
| Cowlitz County, WA | 17,784 | 2,812 | 95.59% | 784 |
| Craig County, OK | 2,285 | 556 | 67.13% | 751 |
| Craig County, VA | 672 | 130 | 64.66% | 237 |
| Craighead County, AR | 18,999 | 4,309 | 88.58% | 2169 |
| Crane County, TX | 1,017 | 133 | 93.69% | 64 |
| Craven County, NC | 15,449 | 3,471 | 94.77% | 809 |
| Crawford County, AR | 11,285 | 2,248 | 87.82% | 1375 |
| Crawford County, GA | 1,910 | 482 | 94.58% | 104 |
| Crawford County, IA | 2,991 | 465 | 70.13% | 893 |
| Crawford County, IL | 2,655 | 433 | 68.34% | 841 |
| Crawford County, IN | 1,662 | 383 | 0.71% | 1650 |
| Crawford County, KS | 5,815 | 1,149 | 89.16% | 630 |
| Crawford County, MI | 1,749 | 440 | 56.71% | 757 |
| Crawford County, MO | 3,939 | 866 | 61.59% | 1513 |
| Crawford County, OH | 6,369 | 1,163 | 86.93% | 833 |
| Crawford County, PA | 12,522 | 2,255 | 76.70% | 2917 |
| Crawford County, WI | 2,418 | 442 | 77.51% | 544 |
| Creek County, OK | 12,386 | 2,181 | 69.07% | 3831 |
| Crenshaw County, AL | 2,321 | 681 | 70.98% | 674 |
| Crisp County, GA | 3,916 | 1,598 | 82.11% | 701 |
| Crittenden County, AR | 9,263 | 2,628 | 79.94% | 1859 |
| Crittenden County, KY | 1,469 | 387 | 67.75% | 474 |
| Crockett County, TN | 2,494 | 585 | 68.89% | 776 |
| Crockett County, TX | 620 | 141 | 0.00% | 620 |
| Crook County, OR | 3,292 | 572 | 59.47% | 1334 |
| Crook County, WY | 1,257 | 153 | 18.93% | 1019 |
| Crosby County, TX | 1,132 | 408 | 70.03% | 339 |
| Cross County, AR | 2,785 | 728 | 58.96% | 1143 |
| Crow Wing County, MN | 10,125 | 1,499 | 92.14% | 796 |
| Crowley County, CO | 519 | 129 | 72.57% | 142 |
| Culberson County, TX | 342 | 114 | 87.45% | 43 |
| Cullman County, AL | 13,241 | 2,624 | 83.33% | 2207 |
| Culpeper County, VA | 9,210 | 977 | 84.62% | 1416 |
| Cumberland County, IL | 1,705 | 240 | 45.68% | 926 |
| Cumberland County, KY | 1,007 | 329 | 70.25% | 300 |
| Cumberland County, ME | 39,135 | 2,842 | 99.75% | 98 |
| Cumberland County, NC | 55,550 | 12,343 | 99.62% | 212 |
| Cumberland County, NJ | 25,992 | 5,435 | 94.37% | 1463 |
| Cumberland County, PA | 36,578 | 3,213 | 95.84% | 1521 |
| Cumberland County, TN | 7,572 | 1,651 | 59.45% | 3070 |
| Cumberland County, VA | 1,399 | 332 | 19.43% | 1127 |
| Cuming County, NE | 1,585 | 160 | 64.58% | 561 |
| Currituck County, NC | 4,426 | 550 | 98.60% | 62 |
| Curry County, NM | 8,741 | 2,151 | 94.23% | 504 |
| Curry County, OR | 2,340 | 511 | 94.63% | 126 |
| Custer County, CO | 515 | 124 | 24.47% | 389 |
| Custer County, ID | 534 | 125 | 59.71% | 215 |
| Custer County, MT | 1,646 | 256 | 92.72% | 120 |
| Custer County, NE | 1,843 | 268 | 44.78% | 1018 |
| Custer County, OK | 5,076 | 847 | 83.17% | 854 |
| Custer County, SD | 836 | 143 | 62.49% | 314 |
| Cuyahoga County, OH | 183,324 | 47,119 | 99.99% | 10 |
| Dade County, GA | 2,278 | 398 | 91.57% | 192 |
| Dade County, MO | 1,159 | 267 | 45.48% | 632 |
| Daggett County, UT | 169 | 11 | 4.06% | 162 |
| Dakota County, MN | 74,927 | 6,085 | 97.97% | 1518 |
| Dakota County, NE | 3,855 | 650 | 90.32% | 373 |
| Dale County, AL | 7,843 | 1,911 | 94.20% | 455 |
| Dallam County, TX | 1,566 | 265 | 98.14% | 29 |
| Dallas County, AL | 6,650 | 3,013 | 78.28% | 1444 |
| Dallas County, IA | 17,837 | 871 | 94.55% | 972 |
| Dallas County, MO | 2,791 | 691 | 23.69% | 2130 |
| Dallas County, TX | 486,970 | 99,481 | 99.84% | 762 |
| Dane County, WI | 78,499 | 6,129 | 96.44% | 2795 |
| Daniels County, MT | 277 | 25 | 99.20% | 2 |
| Danville city, VA | 6,332 | 2,287 | 99.62% | 24 |
| Dare County, NC | 5,096 | 659 | 99.46% | 28 |
| Darke County, OH | 8,775 | 1,051 | 80.31% | 1727 |
| Darlington County, SC | 10,798 | 3,635 | 89.03% | 1184 |
| Dauphin County, PA | 42,535 | 8,641 | 98.73% | 539 |
| Davidson County, NC | 26,521 | 5,310 | 99.62% | 100 |
| Davidson County, TN | 96,269 | 25,159 | 99.29% | 688 |
| Davie County, NC | 6,772 | 913 | 99.40% | 41 |
| Daviess County, IN | 6,893 | 1,026 | 67.29% | 2254 |
| Daviess County, KY | 17,268 | 3,034 | 94.27% | 990 |
| Daviess County, MO | 1,513 | 369 | 48.29% | 782 |
| Davis County, IA | 1,809 | 355 | 80.68% | 349 |
| Davis County, UT | 82,257 | 4,664 | 98.50% | 1236 |
| Davison County, SD | 3,165 | 408 | 94.79% | 165 |
| Dawes County, NE | 1,047 | 174 | 82.86% | 179 |
| Dawson County, GA | 3,736 | 465 | 87.71% | 459 |
| Dawson County, MT | 1,335 | 160 | 90.31% | 129 |
| Dawson County, NE | 4,451 | 725 | 83.16% | 749 |
| Dawson County, TX | 2,308 | 648 | 59.45% | 936 |
| Day County, SD | 956 | 153 | 72.38% | 264 |
| De Kalb County, IN | 7,408 | 835 | 81.04% | 1404 |
| De Soto Parish, LA | 4,814 | 1,123 | 69.94% | 1447 |
| De Witt County, IL | 2,461 | 348 | 74.47% | 628 |
| Deaf Smith County, TX | 4,140 | 1,023 | 90.14% | 408 |
| Dearborn County, IN | 8,218 | 893 | 92.91% | 582 |
| DeBaca County, NM | 305 | 102 | 67.71% | 98 |
| Decatur County, GA | 4,555 | 1,540 | 76.29% | 1080 |
| Decatur County, IA | 1,195 | 300 | 86.37% | 163 |
| Decatur County, IN | 4,629 | 654 | 63.66% | 1682 |
| Decatur County, KS | 386 | 81 | 52.89% | 182 |
| Decatur County, TN | 1,782 | 408 | 55.72% | 789 |
| Deer Lodge County, MT | 873 | 182 | 77.05% | 200 |
| Defiance County, OH | 6,387 | 779 | 82.75% | 1102 |
| DeKalb County, AL | 12,729 | 3,773 | 89.93% | 1282 |
| DeKalb County, GA | 119,570 | 26,688 | 99.42% | 688 |
| DeKalb County, IL | 16,115 | 1,944 | 88.25% | 1893 |
| DeKalb County, MO | 1,530 | 197 | 74.17% | 395 |
| DeKalb County, TN | 3,100 | 711 | 98.89% | 34 |
| Del Norte County, CA | 4,152 | 1,050 | 94.43% | 231 |
| Delaware County, IA | 2,887 | 333 | 77.90% | 638 |
| Delaware County, IN | 14,544 | 3,517 | 94.17% | 849 |
| Delaware County, NY | 5,389 | 1,307 | 82.73% | 931 |
| Delaware County, OH | 40,929 | 1,315 | 97.72% | 933 |
| Delaware County, OK | 6,224 | 1,883 | 73.19% | 1669 |
| Delaware County, PA | 88,674 | 9,970 | 99.05% | 846 |
| Delta County, CO | 4,596 | 981 | 82.63% | 798 |
| Delta County, MI | 5,114 | 809 | 83.72% | 832 |
| Delta County, TX | 855 | 221 | 17.89% | 702 |
| Denali Borough, AK | 270 | 19 | 40.14% | 162 |
| Dent County, MO | 2,475 | 764 | 56.86% | 1068 |
| Denton County, TX | 156,081 | 11,288 | 97.27% | 4264 |
| Denver County, CO | 95,394 | 15,958 | 98.16% | 1753 |
| Des Moines County, IA | 6,281 | 1,171 | 95.58% | 278 |
| Deschutes County, OR | 28,157 | 2,813 | 94.78% | 1470 |
| Desha County, AR | 2,142 | 729 | 72.79% | 583 |
| DeSoto County, FL | 4,841 | 1,647 | 69.32% | 1485 |
| DeSoto County, MS | 35,078 | 4,117 | 97.88% | 743 |
| Deuel County, NE | 296 | 54 | 6.70% | 276 |
| Deuel County, SD | 751 | 76 | 97.75% | 17 |
| Dewey County, OK | 978 | 142 | 24.12% | 742 |
| Dewey County, SD | 1,428 | 453 | 73.57% | 377 |
| DeWitt County, TX | 3,174 | 792 | 56.13% | 1393 |
| Dickens County, TX | 301 | 78 | 91.82% | 25 |
| Dickenson County, VA | 2,149 | 540 | 97.65% | 50 |
| Dickey County, ND | 882 | 84 | 99.79% | 2 |
| Dickinson County, IA | 2,407 | 189 | 90.86% | 220 |
| Dickinson County, KS | 3,220 | 471 | 89.83% | 327 |
| Dickinson County, MI | 3,658 | 525 | 85.90% | 516 |
| Dickson County, TN | 8,951 | 1,561 | 89.85% | 908 |
| Dillon County, SC | 5,668 | 2,900 | 76.50% | 1332 |
| Dimmit County, TX | 2,193 | 729 | 84.67% | 336 |
| Dinwiddie County, VA | 4,250 | 699 | 54.79% | 1921 |
| District of Columbia, DC | 80,789 | 20,062 | 98.99% | 818 |
| Divide County, ND | 370 | 47 | 98.45% | 6 |
| Dixon County, NE | 1,017 | 105 | 86.23% | 140 |
| Doddridge County, WV | 902 | 212 | 32.41% | 610 |
| Dodge County, GA | 2,863 | 894 | 64.69% | 1011 |
| Dodge County, MN | 3,983 | 243 | 74.41% | 1019 |
| Dodge County, NE | 6,236 | 677 | 92.19% | 487 |
| Dodge County, WI | 12,907 | 1,195 | 80.19% | 2557 |
| Dolores County, CO | 338 | 48 | 12.89% | 294 |
| Dona Ana County, NM | 38,309 | 12,463 | 86.72% | 5087 |
| Doniphan County, KS | 1,171 | 192 | 81.47% | 217 |
| Donley County, TX | 472 | 127 | 40.66% | 280 |
| Dooly County, GA | 1,807 | 584 | 68.50% | 569 |
| Door County, WI | 3,309 | 374 | 62.42% | 1244 |
| Dorchester County, MD | 4,838 | 1,219 | 79.36% | 999 |
| Dorchester County, SC | 28,932 | 4,819 | 94.51% | 1587 |
| Dougherty County, GA | 14,972 | 5,812 | 99.26% | 110 |
| Douglas County, CO | 68,575 | 1,453 | 97.05% | 2024 |
| Douglas County, GA | 27,899 | 5,362 | 98.90% | 308 |
| Douglas County, IL | 3,520 | 415 | 69.07% | 1089 |
| Douglas County, KS | 15,657 | 1,551 | 93.51% | 1017 |
| Douglas County, MN | 5,816 | 513 | 84.26% | 916 |
| Douglas County, MO | 2,089 | 581 | 23.43% | 1600 |
| Douglas County, NE | 99,467 | 11,901 | 98.69% | 1301 |
| Douglas County, NV | 6,115 | 612 | 93.78% | 380 |
| Douglas County, OR | 14,972 | 2,855 | 90.65% | 1400 |
| Douglas County, SD | 499 | 81 | 82.38% | 88 |
| Douglas County, WA | 8,142 | 1,121 | 92.95% | 574 |
| Douglas County, WI | 6,230 | 804 | 79.46% | 1280 |
| Drew County, AR | 2,710 | 696 | 68.45% | 855 |
| Dubois County, IN | 7,288 | 693 | 71.01% | 2113 |
| Dubuque County, IA | 15,575 | 1,654 | 98.12% | 292 |
| Duchesne County, UT | 4,800 | 598 | 81.29% | 898 |
| Dukes County, MA | 2,192 | 247 | 92.58% | 163 |
| Dundy County, NE | 248 | 50 | 81.13% | 47 |
| Dunklin County, MO | 5,343 | 1,963 | 89.37% | 568 |
| Dunn County, ND | 707 | 83 | 99.29% | 5 |
| Dunn County, WI | 6,343 | 715 | 75.56% | 1550 |
| DuPage County, IL | 154,205 | 11,173 | 99.64% | 558 |
| Duplin County, NC | 10,111 | 2,761 | 66.14% | 3424 |
| Durham County, NC | 44,393 | 8,406 | 99.24% | 339 |
| Dutchess County, NY | 40,458 | 4,159 | 99.75% | 102 |
| Duval County, FL | 147,750 | 29,076 | 98.04% | 2889 |
| Duval County, TX | 1,984 | 722 | 78.61% | 424 |
| Dyer County, TN | 6,433 | 1,648 | 93.90% | 392 |
| Eagle County, CO | 8,810 | 637 | 89.74% | 904 |
| East Baton Rouge Parish, LA | 70,206 | 16,210 | 98.51% | 1044 |
| East Carroll Parish, LA | 1,189 | 771 | 70.40% | 352 |
| East Feliciana Parish, LA | 2,527 | 597 | 61.54% | 972 |
| Eastland County, TX | 2,750 | 700 | 29.75% | 1932 |
| Eaton County, MI | 16,382 | 1,807 | 82.81% | 2816 |
| Eau Claire County, WI | 14,811 | 1,739 | 92.51% | 1109 |
| Ector County, TX | 33,939 | 5,861 | 90.75% | 3140 |
| Eddy County, ND | 384 | 48 | 93.17% | 26 |
| Eddy County, NM | 10,789 | 1,837 | 89.80% | 1101 |
| Edgar County, IL | 2,554 | 468 | 62.23% | 965 |
| Edgecombe County, NC | 8,550 | 2,909 | 88.55% | 979 |
| Edgefield County, SC | 3,784 | 857 | 70.20% | 1128 |
| Edmonson County, KY | 1,601 | 342 | 86.94% | 209 |
| Edmunds County, SD | 555 | 85 | 92.80% | 40 |
| Edwards County, IL | 1,049 | 141 | 68.61% | 329 |
| Edwards County, KS | 486 | 74 | 72.28% | 135 |
| Effingham County, GA | 11,991 | 1,403 | 94.88% | 614 |
| Effingham County, IL | 5,707 | 687 | 76.56% | 1338 |
| El Dorado County, CA | 28,705 | 2,394 | 84.36% | 4490 |
| El Paso County, CO | 121,892 | 15,703 | 93.56% | 7844 |
| El Paso County, TX | 163,309 | 48,513 | 99.19% | 1315 |
| Elbert County, CO | 4,438 | 283 | 58.33% | 1850 |
| Elbert County, GA | 2,937 | 881 | 80.56% | 571 |
| Elk County, KS | 386 | 107 | 62.63% | 144 |
| Elk County, PA | 4,234 | 492 | 95.52% | 190 |
| Elkhart County, IN | 39,902 | 5,685 | 83.45% | 6605 |
| Elko County, NV | 10,096 | 935 | 9.10% | 9177 |
| Ellis County, KS | 4,407 | 494 | 98.86% | 50 |
| Ellis County, OK | 677 | 111 | 58.59% | 280 |
| Ellis County, TX | 35,093 | 4,640 | 80.76% | 6751 |
| Ellsworth County, KS | 796 | 109 | 64.57% | 282 |
| Elmore County, AL | 13,294 | 2,100 | 94.76% | 696 |
| Elmore County, ID | 4,551 | 944 | 80.32% | 895 |
| Emanuel County, GA | 4,012 | 1,345 | 95.08% | 197 |
| Emery County, UT | 2,256 | 329 | 96.41% | 81 |
| Emmet County, IA | 1,277 | 206 | 77.77% | 284 |
| Emmet County, MI | 4,662 | 501 | 91.96% | 375 |
| Emmons County, ND | 477 | 73 | 100.00% | - |
| Emporia city, VA | 906 | 290 | 97.44% | 23 |
| Erath County, TX | 6,115 | 1,152 | 67.80% | 1969 |
| Erie County, NY | 133,786 | 23,819 | 99.84% | 208 |
| Erie County, OH | 10,828 | 1,760 | 96.56% | 372 |
| Erie County, PA | 41,617 | 8,647 | 94.05% | 2475 |
| Escambia County, AL | 5,921 | 1,867 | 75.14% | 1472 |
| Escambia County, FL | 45,751 | 10,096 | 97.15% | 1306 |
| Esmeralda County, NV | 98 | 19 | 0.00% | 98 |
| Essex County, MA | 122,194 | 15,225 | 99.23% | 946 |
| Essex County, NJ | 135,041 | 27,059 | 99.26% | 995 |
| Essex County, NY | 4,309 | 684 | 88.77% | 484 |
| Essex County, VA | 1,397 | 316 | 69.14% | 431 |
| Essex County, VT | 785 | 182 | 65.83% | 268 |
| Estill County, KY | 2,211 | 680 | 96.99% | 66 |
| Etowah County, AL | 15,684 | 3,930 | 95.83% | 655 |
| Eureka County, NV | 365 | 30 | 0.00% | 365 |
| Evans County, GA | 2,086 | 743 | 83.45% | 345 |
| Fairbanks North Star Borough, AK | 15,908 | 1,361 | 86.49% | 2149 |
| Fairfax city, VA | 3,457 | 280 | 96.93% | 106 |
| Fairfax County, VA | 194,051 | 13,005 | 98.31% | 3286 |
| Fairfield County, CT | 158,972 | 19,429 | 99.92% | 134 |
| Fairfield County, OH | 27,447 | 2,857 | 95.14% | 1335 |
| Fairfield County, SC | 3,257 | 1,015 | 62.00% | 1238 |
| Fall River County, SD | 873 | 156 | 91.98% | 70 |
| Fallon County, MT | 562 | 62 | 80.03% | 112 |
| Falls Church city, VA | 2,791 | 68 | 99.18% | 23 |
| Falls County, TX | 2,536 | 662 | 28.88% | 1804 |
| Fannin County, GA | 3,164 | 788 | 90.67% | 295 |
| Fannin County, TX | 5,601 | 1,015 | 42.53% | 3219 |
| Faribault County, MN | 2,138 | 328 | 78.41% | 462 |
| Faulk County, SD | 265 | 64 | 92.72% | 19 |
| Faulkner County, AR | 20,683 | 3,439 | 88.32% | 2416 |
| Fauquier County, VA | 12,104 | 737 | 70.77% | 3538 |
| Fayette County, GA | 20,743 | 1,358 | 99.57% | 90 |
| Fayette County, IA | 2,934 | 437 | 80.18% | 582 |
| Fayette County, IL | 3,140 | 631 | 49.28% | 1593 |
| Fayette County, IN | 3,616 | 695 | 77.55% | 812 |
| Fayette County, KY | 46,978 | 7,548 | 99.66% | 159 |
| Fayette County, OH | 4,807 | 973 | 86.46% | 651 |
| Fayette County, PA | 17,881 | 3,367 | 90.03% | 1782 |
| Fayette County, TN | 5,500 | 1,076 | 83.75% | 894 |
| Fayette County, TX | 3,791 | 762 | 69.65% | 1151 |
| Fayette County, WV | 6,422 | 1,715 | 75.38% | 1581 |
| Fentress County, TN | 2,807 | 784 | 99.01% | 28 |
| Fergus County, MT | 1,619 | 235 | 85.01% | 243 |
| Ferry County, WA | 922 | 214 | 99.96% | - |
| Fillmore County, MN | 3,720 | 508 | 58.31% | 1551 |
| Fillmore County, NE | 707 | 81 | 60.70% | 278 |
| Finney County, KS | 7,692 | 1,259 | 83.19% | 1293 |
| Fisher County, TX | 590 | 113 | 8.83% | 538 |
| Flagler County, FL | 14,211 | 2,330 | 98.92% | 153 |
| Flathead County, MT | 16,136 | 2,200 | 88.81% | 1806 |
| Fleming County, KY | 2,501 | 664 | 82.16% | 446 |
| Florence County, SC | 24,093 | 5,915 | 93.81% | 1492 |
| Florence County, WI | 464 | 81 | 88.61% | 53 |
| Floyd County, GA | 16,287 | 4,826 | 95.69% | 701 |
| Floyd County, IA | 2,587 | 419 | 88.12% | 307 |
| Floyd County, IN | 12,710 | 1,801 | 98.45% | 197 |
| Floyd County, KY | 5,583 | 2,576 | 91.27% | 487 |
| Floyd County, TX | 1,186 | 367 | 50.33% | 589 |
| Floyd County, VA | 2,288 | 382 | 64.12% | 821 |
| Fluvanna County, VA | 3,901 | 312 | 85.01% | 585 |
| Foard County, TX | 201 | 54 | 99.93% | - |
| Fond du Lac County, WI | 16,018 | 1,543 | 85.11% | 2385 |
| Ford County, IL | 2,191 | 318 | 67.98% | 702 |
| Ford County, KS | 6,983 | 1,069 | 82.10% | 1250 |
| Forest County, PA | 463 | 108 | 73.38% | 123 |
| Forest County, WI | 1,181 | 242 | 44.40% | 657 |
| Forrest County, MS | 12,289 | 3,973 | 90.71% | 1142 |
| Forsyth County, GA | 50,052 | 2,394 | 99.79% | 104 |
| Forsyth County, NC | 63,017 | 14,511 | 99.99% | 8 |
| Fort Bend County, TX | 160,361 | 15,736 | 95.26% | 7597 |
| Foster County, ND | 474 | 47 | 100.00% | - |
| Fountain County, IN | 2,580 | 379 | 62.67% | 963 |
| Franklin city, VA | 1,432 | 467 | 100.00% | - |
| Franklin County, AL | 5,511 | 1,589 | 64.92% | 1933 |
| Franklin County, AR | 2,981 | 621 | 23.32% | 2286 |
| Franklin County, FL | 1,330 | 475 | 97.61% | 32 |
| Franklin County, GA | 3,551 | 886 | 61.99% | 1350 |
| Franklin County, IA | 1,682 | 262 | 60.42% | 666 |
| Franklin County, ID | 3,333 | 361 | 59.40% | 1353 |
| Franklin County, IL | 6,069 | 1,463 | 78.52% | 1304 |
| Franklin County, IN | 3,772 | 401 | 39.13% | 2296 |
| Franklin County, KS | 4,422 | 520 | 66.36% | 1487 |
| Franklin County, KY | 7,506 | 1,316 | 98.05% | 146 |
| Franklin County, MA | 8,880 | 1,143 | 80.48% | 1734 |
| Franklin County, ME | 3,787 | 707 | 90.12% | 374 |
| Franklin County, MO | 17,076 | 2,060 | 74.63% | 4332 |
| Franklin County, MS | 1,383 | 349 | 27.35% | 1005 |
| Franklin County, NC | 10,751 | 2,013 | 87.77% | 1315 |
| Franklin County, NE | 422 | 73 | 36.12% | 270 |
| Franklin County, NY | 7,102 | 1,420 | 92.60% | 525 |
| Franklin County, OH | 207,668 | 46,012 | 100.00% | 3 |
| Franklin County, PA | 23,959 | 4,117 | 91.81% | 1963 |
| Franklin County, TN | 6,167 | 1,189 | 82.00% | 1110 |
| Franklin County, TX | 1,928 | 405 | 70.67% | 565 |
| Franklin County, VA | 7,910 | 1,742 | 81.91% | 1431 |
| Franklin County, VT | 7,782 | 963 | 88.53% | 893 |
| Franklin County, WA | 21,749 | 3,446 | 85.34% | 3188 |
| Franklin Parish, LA | 3,665 | 1,308 | 56.34% | 1600 |
| Frederick County, MD | 43,518 | 3,081 | 94.59% | 2352 |
| Frederick County, VA | 14,591 | 1,350 | 82.40% | 2568 |
| Fredericksburg city, VA | 3,948 | 829 | 95.30% | 185 |
| Freeborn County, MN | 4,759 | 591 | 86.87% | 625 |
| Freestone County, TX | 3,313 | 611 | 72.16% | 922 |
| Fremont County, CO | 5,600 | 1,287 | 83.82% | 906 |
| Fremont County, IA | 1,101 | 172 | 68.38% | 348 |
| Fremont County, ID | 2,392 | 503 | 46.82% | 1272 |
| Fremont County, WY | 7,278 | 1,378 | 64.24% | 2603 |
| Fresno County, CA | 201,858 | 59,089 | 92.35% | 15440 |
| Frio County, TX | 3,251 | 1,063 | 89.20% | 351 |
| Frontier County, NE | 346 | 64 | 13.46% | 299 |
| Fulton County, AR | 1,879 | 562 | 38.94% | 1147 |
| Fulton County, GA | 164,814 | 30,619 | 98.80% | 1985 |
| Fulton County, IL | 4,986 | 918 | 74.75% | 1259 |
| Fulton County, IN | 3,338 | 765 | 77.14% | 763 |
| Fulton County, KY | 923 | 402 | 73.73% | 243 |
| Fulton County, NY | 7,757 | 1,447 | 92.83% | 556 |
| Fulton County, OH | 7,231 | 659 | 78.60% | 1548 |
| Fulton County, PA | 2,069 | 339 | 45.25% | 1133 |
| Furnas County, NE | 729 | 120 | 25.83% | 541 |
| Gadsden County, FL | 7,273 | 3,148 | 91.23% | 638 |
| Gage County, NE | 3,488 | 418 | 73.27% | 932 |
| Gaines County, TX | 5,306 | 1,184 | 69.70% | 1608 |
| Galax city, VA | 1,073 | 335 | 96.76% | 35 |
| Gallatin County, IL | 757 | 202 | 70.12% | 226 |
| Gallatin County, KY | 1,520 | 351 | 74.22% | 392 |
| Gallatin County, MT | 15,719 | 1,043 | 85.53% | 2274 |
| Gallia County, OH | 4,813 | 1,464 | 51.84% | 2318 |
| Galveston County, TX | 59,399 | 9,137 | 96.56% | 2044 |
| Garden County, NE | 279 | 68 | 22.85% | 215 |
| Garfield County, CO | 10,715 | 1,149 | 82.96% | 1826 |
| Garfield County, MT | 207 | 53 | 47.68% | 108 |
| Garfield County, NE | 265 | 46 | 0.63% | 263 |
| Garfield County, OK | 10,899 | 2,271 | 88.26% | 1280 |
| Garfield County, UT | 827 | 143 | 97.99% | 17 |
| Garfield County, WA | 318 | 58 | 10.64% | 284 |
| Garland County, AR | 13,920 | 4,501 | 91.71% | 1153 |
| Garrard County, KY | 2,770 | 582 | 88.58% | 316 |
| Garrett County, MD | 3,807 | 684 | 75.24% | 943 |
| Garvin County, OK | 4,961 | 887 | 59.42% | 2013 |
| Garza County, TX | 753 | 192 | 91.94% | 61 |
| Gasconade County, MO | 2,188 | 357 | 23.82% | 1667 |
| Gaston County, NC | 35,858 | 5,942 | 99.94% | 21 |
| Gates County, NC | 1,760 | 344 | 61.67% | 675 |
| Geary County, KS | 5,964 | 1,090 | 87.03% | 774 |
| Geauga County, OH | 16,356 | 989 | 90.02% | 1633 |
| Gem County, ID | 2,901 | 543 | 79.92% | 582 |
| Genesee County, MI | 65,742 | 16,980 | 98.92% | 708 |
| Genesee County, NY | 8,481 | 1,045 | 95.14% | 412 |
| Geneva County, AL | 4,280 | 1,149 | 55.18% | 1918 |
| Gentry County, MO | 1,142 | 223 | 88.94% | 126 |
| George County, MS | 4,474 | 1,027 | 84.72% | 684 |
| Georgetown County, SC | 8,520 | 2,606 | 88.76% | 958 |
| Gibson County, IN | 5,586 | 597 | 71.44% | 1595 |
| Gibson County, TN | 8,675 | 1,741 | 74.31% | 2228 |
| Gila County, AZ | 7,549 | 2,483 | 71.72% | 2135 |
| Gilchrist County, FL | 2,592 | 607 | 26.60% | 1902 |
| Giles County, TN | 4,455 | 943 | 55.07% | 2002 |
| Giles County, VA | 2,521 | 413 | 73.37% | 671 |
| Gillespie County, TX | 3,951 | 576 | 73.20% | 1059 |
| Gilliam County, OR | 267 | 39 | 60.13% | 106 |
| Gilmer County, GA | 4,154 | 1,235 | 82.95% | 708 |
| Gilmer County, WV | 830 | 201 | 37.50% | 519 |
| Gilpin County, CO | 705 | 51 | 51.59% | 341 |
| Glades County, FL | 1,615 | 382 | 71.31% | 463 |
| Gladwin County, MI | 3,313 | 855 | 76.28% | 786 |
| Glascock County, GA | 503 | 96 | 0.75% | 499 |
| Glasscock County, TX | 270 | 35 | 84.91% | 41 |
| Glenn County, CA | 5,381 | 963 | 80.52% | 1048 |
| Gloucester County, NJ | 47,735 | 3,768 | 99.15% | 408 |
| Gloucester County, VA | 5,435 | 651 | 94.29% | 310 |
| Glynn County, GA | 13,415 | 3,339 | 98.47% | 206 |
| Gogebic County, MI | 1,711 | 416 | 85.57% | 247 |
| Golden Valley County, MT | 102 | 32 | 88.91% | 11 |
| Golden Valley County, ND | 236 | 38 | 65.36% | 82 |
| Goliad County, TX | 1,164 | 256 | 25.46% | 868 |
| Gonzales County, TX | 4,019 | 983 | 41.90% | 2335 |
| Goochland County, VA | 3,143 | 227 | 66.99% | 1037 |
| Goodhue County, MN | 7,429 | 497 | 82.56% | 1295 |
| Gooding County, ID | 3,042 | 547 | 53.72% | 1408 |
| Gordon County, GA | 10,234 | 2,556 | 93.60% | 655 |
| Goshen County, WY | 1,822 | 295 | 64.52% | 646 |
| Gosper County, NE | 324 | 49 | 18.84% | 263 |
| Gove County, KS | 446 | 77 | 74.69% | 113 |
| Grady County, GA | 4,447 | 1,346 | 82.73% | 768 |
| Grady County, OK | 10,016 | 1,272 | 64.46% | 3560 |
| Grafton County, NH | 10,488 | 1,174 | 92.70% | 765 |
| Graham County, AZ | 7,395 | 1,715 | 67.87% | 2376 |
| Graham County, KS | 379 | 55 | 98.81% | 5 |
| Graham County, NC | 1,240 | 301 | 52.87% | 584 |
| Grainger County, TN | 3,459 | 798 | 66.68% | 1152 |
| Grand County, CO | 1,959 | 213 | 78.71% | 417 |
| Grand County, UT | 1,437 | 226 | 93.01% | 100 |
| Grand Forks County, ND | 9,977 | 930 | 89.11% | 1087 |
| Grand Isle County, VT | 959 | 108 | 64.59% | 340 |
| Grand Traverse County, MI | 13,557 | 1,386 | 95.07% | 668 |
| Granite County, MT | 395 | 69 | 19.97% | 316 |
| Grant County, AR | 3,038 | 485 | 49.19% | 1544 |
| Grant County, IN | 9,720 | 2,501 | 85.89% | 1371 |
| Grant County, KS | 1,670 | 267 | 100.00% | - |
| Grant County, KY | 4,596 | 844 | 94.16% | 269 |
| Grant County, MN | 962 | 132 | 87.30% | 122 |
| Grant County, ND | 341 | 65 | 96.41% | 12 |
| Grant County, NE | 104 | 20 | 26.55% | 76 |
| Grant County, NM | 3,932 | 1,150 | 83.61% | 645 |
| Grant County, OK | 752 | 115 | 54.25% | 344 |
| Grant County, OR | 942 | 174 | 64.42% | 335 |
| Grant County, SD | 1,155 | 136 | 73.60% | 305 |
| Grant County, WA | 20,659 | 3,327 | 85.96% | 2899 |
| Grant County, WI | 7,634 | 1,049 | 78.85% | 1615 |
| Grant County, WV | 1,578 | 326 | 46.88% | 838 |
| Grant Parish, LA | 3,363 | 809 | 37.48% | 2103 |
| Granville County, NC | 8,968 | 1,650 | 86.94% | 1172 |
| Gratiot County, MI | 5,820 | 1,143 | 76.29% | 1380 |
| Graves County, KY | 6,195 | 1,515 | 95.18% | 299 |
| Gray County, KS | 1,271 | 103 | 57.94% | 535 |
| Gray County, TX | 4,071 | 832 | 87.74% | 499 |
| Grays Harbor County, WA | 10,816 | 2,363 | 91.21% | 951 |
| Grayson County, KY | 4,410 | 1,259 | 90.31% | 427 |
| Grayson County, TX | 22,824 | 3,588 | 84.33% | 3576 |
| Grayson County, VA | 1,899 | 512 | 76.01% | 456 |
| Greeley County, KS | 246 | 42 | 60.87% | 96 |
| Greeley County, NE | 378 | 72 | 18.75% | 307 |
| Green County, KY | 1,655 | 407 | 84.49% | 257 |
| Green County, WI | 6,099 | 527 | 76.73% | 1419 |
| Green Lake County, WI | 3,069 | 473 | 69.62% | 932 |
| Greenbrier County, WV | 4,752 | 1,014 | 69.04% | 1471 |
| Greene County, AR | 7,856 | 1,558 | 80.44% | 1536 |
| Greene County, GA | 2,375 | 794 | 69.44% | 726 |
| Greene County, IA | 1,477 | 230 | 88.24% | 174 |
| Greene County, IL | 2,041 | 384 | 47.34% | 1075 |
| Greene County, IN | 5,174 | 874 | 80.07% | 1031 |
| Greene County, MO | 41,938 | 7,018 | 94.68% | 2229 |
| Greene County, MS | 2,003 | 468 | 26.92% | 1464 |
| Greene County, NY | 5,566 | 935 | 86.01% | 779 |
| Greene County, OH | 24,661 | 2,744 | 97.62% | 586 |
| Greene County, PA | 5,030 | 977 | 78.47% | 1083 |
| Greene County, TN | 9,722 | 2,174 | 96.73% | 318 |
| Greene County, VA | 3,433 | 395 | 85.49% | 498 |
| Greenlee County, AZ | 1,775 | 203 | 57.02% | 763 |
| Greensville County, VA | 1,366 | 365 | 28.56% | 976 |
| Greenup County, KY | 5,531 | 1,096 | 93.10% | 382 |
| Greenville County, SC | 85,146 | 11,436 | 98.64% | 1160 |
| Greenwood County, KS | 947 | 179 | 67.77% | 305 |
| Greenwood County, SC | 11,549 | 3,289 | 91.06% | 1033 |
| Greer County, OK | 864 | 239 | 48.16% | 448 |
| Gregg County, TX | 22,719 | 4,589 | 92.29% | 1751 |
| Gregory County, SD | 701 | 137 | 91.57% | 59 |
| Grenada County, MS | 3,655 | 1,081 | 86.40% | 497 |
| Griggs County, ND | 329 | 36 | 91.53% | 28 |
| Grimes County, TX | 4,612 | 1,110 | 52.86% | 2174 |
| Grundy County, IA | 2,093 | 174 | 75.97% | 503 |
| Grundy County, IL | 9,531 | 732 | 89.13% | 1036 |
| Grundy County, MO | 1,595 | 404 | 9.84% | 1438 |
| Grundy County, TN | 2,080 | 554 | 78.90% | 439 |
| Guadalupe County, NM | 685 | 184 | 64.67% | 242 |
| Guadalupe County, TX | 30,362 | 3,418 | 93.18% | 2072 |
| Guernsey County, OH | 6,195 | 1,391 | 59.67% | 2498 |
| Guilford County, NC | 85,481 | 18,903 | 99.92% | 72 |
| Gulf County, FL | 1,806 | 466 | 95.15% | 88 |
| Gunnison County, CO | 2,160 | 198 | 85.35% | 316 |
| Guthrie County, IA | 1,768 | 206 | 84.71% | 270 |
| Gwinnett County, GA | 184,871 | 21,985 | 99.48% | 956 |
| Haakon County, SD | 336 | 39 | 90.66% | 31 |
| Habersham County, GA | 7,361 | 1,384 | 83.94% | 1182 |
| Haines Borough, AK | 331 | 47 | 92.94% | 23 |
| Hale County, AL | 2,395 | 814 | 58.35% | 998 |
| Hale County, TX | 6,805 | 1,707 | 84.26% | 1071 |
| Halifax County, NC | 7,888 | 2,469 | 85.24% | 1164 |
| Halifax County, VA | 5,032 | 1,029 | 51.62% | 2434 |
| Hall County, GA | 36,811 | 7,332 | 98.92% | 396 |
| Hall County, NE | 11,728 | 1,877 | 92.16% | 920 |
| Hall County, TX | 546 | 196 | 58.66% | 226 |
| Hamblen County, TN | 10,854 | 2,132 | 100.00% | - |
| Hamilton County, FL | 1,829 | 661 | 57.56% | 776 |
| Hamilton County, IA | 2,366 | 269 | 84.62% | 364 |
| Hamilton County, IL | 1,312 | 239 | 61.00% | 512 |
| Hamilton County, IN | 66,523 | 2,581 | 97.11% | 1924 |
| Hamilton County, KS | 539 | 103 | 100.00% | - |
| Hamilton County, NE | 1,593 | 119 | 17.33% | 1317 |
| Hamilton County, NY | 451 | 59 | 22.02% | 352 |
| Hamilton County, OH | 131,905 | 26,086 | 99.99% | 9 |
| Hamilton County, TN | 53,428 | 7,923 | 99.35% | 349 |
| Hamilton County, TX | 1,337 | 313 | 30.54% | 929 |
| Hamlin County, SD | 1,343 | 140 | 70.12% | 401 |
| Hampden County, MA | 73,670 | 18,465 | 98.17% | 1352 |
| Hampshire County, MA | 17,784 | 1,488 | 87.17% | 2281 |
| Hampshire County, WV | 3,058 | 886 | 28.00% | 2202 |
| Hampton city, VA | 19,621 | 4,444 | 97.79% | 433 |
| Hampton County, SC | 3,047 | 1,140 | 51.32% | 1483 |
| Hancock County, GA | 960 | 415 | 60.31% | 381 |
| Hancock County, IA | 1,683 | 177 | 88.81% | 188 |
| Hancock County, IL | 2,695 | 384 | 78.15% | 589 |
| Hancock County, IN | 13,154 | 771 | 99.56% | 58 |
| Hancock County, KY | 1,591 | 236 | 21.19% | 1254 |
| Hancock County, ME | 6,704 | 1,010 | 89.69% | 691 |
| Hancock County, MS | 7,014 | 1,772 | 93.63% | 447 |
| Hancock County, OH | 11,959 | 1,435 | 92.53% | 893 |
| Hancock County, TN | 993 | 393 | 63.85% | 359 |
| Hancock County, WV | 4,091 | 738 | 94.71% | 217 |
| Hand County, SD | 526 | 61 | 74.61% | 134 |
| Hanover County, VA | 17,914 | 997 | 89.42% | 1895 |
| Hansford County, TX | 1,165 | 193 | 61.30% | 451 |
| Hanson County, SD | 609 | 76 | 82.95% | 104 |
| Haralson County, GA | 5,188 | 1,026 | 67.46% | 1688 |
| Hardee County, FL | 5,119 | 1,902 | 68.10% | 1633 |
| Hardeman County, TN | 3,551 | 978 | 49.83% | 1782 |
| Hardeman County, TX | 621 | 158 | 9.93% | 559 |
| Hardin County, IA | 2,321 | 319 | 88.88% | 258 |
| Hardin County, IL | 529 | 151 | 100.00% | - |
| Hardin County, KY | 19,135 | 3,081 | 100.00% | - |
| Hardin County, OH | 5,190 | 829 | 76.48% | 1221 |
| Hardin County, TN | 3,840 | 986 | 68.04% | 1227 |
| Hardin County, TX | 10,155 | 1,620 | 80.13% | 2017 |
| Harding County, NM | 53 | 12 | 49.50% | 27 |
| Harding County, SD | 182 | 18 | 100.00% | - |
| Hardy County, WV | 2,011 | 397 | 87.58% | 250 |
| Harford County, MD | 41,461 | 3,562 | 98.42% | 657 |
| Harlan County, KY | 4,236 | 1,842 | 89.94% | 426 |
| Harlan County, NE | 522 | 74 | 2.54% | 509 |
| Harmon County, OK | 497 | 148 | 59.03% | 204 |
| Harnett County, NC | 24,430 | 5,000 | 96.06% | 962 |
| Harney County, OR | 996 | 223 | 25.82% | 739 |
| Harper County, KS | 987 | 187 | 60.08% | 394 |
| Harper County, OK | 746 | 109 | 80.11% | 148 |
| Harris County, GA | 5,583 | 678 | 89.97% | 560 |
| Harris County, TX | 885,395 | 211,735 | 96.91% | 27315 |
| Harrison County, IA | 2,348 | 284 | 69.95% | 706 |
| Harrison County, IN | 6,504 | 787 | 82.14% | 1162 |
| Harrison County, KY | 2,979 | 609 | 70.06% | 892 |
| Harrison County, MO | 1,457 | 303 | 51.24% | 710 |
| Harrison County, MS | 35,338 | 9,514 | 97.86% | 758 |
| Harrison County, OH | 2,311 | 465 | 51.77% | 1115 |
| Harrison County, TX | 12,286 | 2,769 | 78.12% | 2688 |
| Harrison County, WV | 10,408 | 2,339 | 89.48% | 1095 |
| Harrisonburg city, VA | 5,931 | 1,171 | 92.18% | 464 |
| Hart County, GA | 3,998 | 919 | 83.90% | 644 |
| Hart County, KY | 3,214 | 890 | 91.09% | 286 |
| Hartford County, CT | 137,597 | 20,405 | 98.49% | 2085 |
| Hartley County, TX | 881 | 87 | 90.66% | 82 |
| Harvey County, KS | 6,009 | 765 | 86.19% | 830 |
| Haskell County, KS | 830 | 113 | 72.02% | 232 |
| Haskell County, OK | 2,180 | 621 | 37.02% | 1373 |
| Haskell County, TX | 838 | 263 | 97.08% | 24 |
| Hawaii County, HI | 30,875 | 6,188 | 88.63% | 3511 |
| Hawkins County, TN | 8,332 | 2,105 | 73.61% | 2199 |
| Hayes County, NE | 132 | 26 | 3.93% | 127 |
| Hays County, TX | 36,487 | 4,102 | 95.50% | 1642 |
| Haywood County, NC | 8,079 | 1,622 | 92.22% | 629 |
| Haywood County, TN | 2,842 | 777 | 65.31% | 986 |
| Heard County, GA | 1,984 | 465 | 66.43% | 666 |
| Hemphill County, TX | 910 | 109 | 0.00% | 910 |
| Hempstead County, AR | 3,951 | 1,198 | 65.35% | 1369 |
| Henderson County, IL | 842 | 123 | 45.94% | 455 |
| Henderson County, KY | 7,556 | 1,594 | 95.50% | 340 |
| Henderson County, NC | 16,051 | 2,403 | 97.18% | 452 |
| Henderson County, TN | 4,650 | 1,039 | 64.45% | 1653 |
| Henderson County, TX | 12,858 | 3,586 | 71.48% | 3667 |
| Hendricks County, IN | 31,358 | 1,919 | 98.02% | 620 |
| Hendry County, FL | 7,693 | 2,425 | 81.95% | 1388 |
| Hennepin County, MN | 191,381 | 21,442 | 99.29% | 1357 |
| Henrico County, VA | 53,869 | 6,171 | 99.13% | 468 |
| Henry County, AL | 2,584 | 630 | 58.61% | 1069 |
| Henry County, GA | 44,748 | 5,254 | 99.91% | 39 |
| Henry County, IA | 3,079 | 375 | 89.25% | 331 |
| Henry County, IL | 7,912 | 1,205 | 88.04% | 946 |
| Henry County, IN | 7,205 | 1,133 | 92.32% | 553 |
| Henry County, KY | 2,756 | 541 | 68.42% | 870 |
| Henry County, MO | 3,362 | 752 | 46.98% | 1783 |
| Henry County, OH | 4,593 | 721 | 76.58% | 1076 |
| Henry County, TN | 4,823 | 1,351 | 88.35% | 562 |
| Henry County, VA | 7,379 | 1,845 | 96.52% | 257 |
| Herkimer County, NY | 9,349 | 1,727 | 86.73% | 1241 |
| Hernando County, FL | 25,715 | 4,643 | 96.84% | 813 |
| Hertford County, NC | 3,307 | 1,012 | 81.43% | 614 |
| Hettinger County, ND | 427 | 62 | 100.00% | - |
| Hickman County, KY | 618 | 157 | 42.25% | 357 |
| Hickman County, TN | 3,711 | 851 | 69.53% | 1131 |
| Hidalgo County, TX | 202,747 | 82,415 | 94.75% | 10648 |
| Highland County, OH | 7,334 | 1,483 | 76.51% | 1723 |
| Highland County, VA | 185 | 43 | 19.78% | 148 |
| Highlands County, FL | 12,840 | 5,006 | 88.58% | 1467 |
| Hill County, MT | 2,941 | 508 | 96.25% | 110 |
| Hill County, TX | 6,198 | 1,199 | 34.81% | 4041 |
| Hillsborough County, FL | 230,185 | 42,242 | 99.56% | 1015 |
| Hillsborough County, NH | 61,557 | 5,663 | 98.04% | 1206 |
| Hillsdale County, MI | 7,002 | 1,300 | 63.51% | 2555 |
| Hinds County, MS | 41,174 | 11,777 | 95.08% | 2026 |
| Hinsdale County, CO | 85 | 14 | 60.26% | 34 |
| Hitchcock County, NE | 480 | 92 | 2.65% | 467 |
| Hocking County, OH | 4,518 | 863 | 61.62% | 1734 |
| Hockley County, TX | 4,310 | 1,209 | 57.61% | 1827 |
| Hodgeman County, KS | 282 | 37 | 44.94% | 155 |
| Hoke County, NC | 10,022 | 2,485 | 91.04% | 898 |
| Holmes County, MS | 3,282 | 1,413 | 64.83% | 1154 |
| Holmes County, OH | 9,990 | 1,181 | 45.05% | 5489 |
| Holt County, MO | 675 | 122 | 55.07% | 303 |
| Holt County, NE | 1,796 | 286 | 64.57% | 636 |
| Honolulu County, HI | 143,822 | 13,104 | 99.02% | 1415 |
| Hood County, TX | 9,275 | 1,377 | 90.44% | 887 |
| Hood River County, OR | 3,985 | 535 | 96.28% | 148 |
| Hooker County, NE | 109 | 13 | 24.59% | 82 |
| Hoonah-Angoon Census Area, AK | 293 | 76 | 25.58% | 218 |
| Hopewell city, VA | 4,042 | 1,097 | 98.63% | 55 |
| Hopkins County, KY | 7,321 | 1,677 | 90.41% | 702 |
| Hopkins County, TX | 6,590 | 1,339 | 60.87% | 2578 |
| Horry County, SC | 44,834 | 10,484 | 99.48% | 234 |
| Hot Spring County, AR | 4,827 | 1,433 | 54.24% | 2209 |
| Hot Springs County, WY | 698 | 117 | 88.76% | 78 |
| Houghton County, MI | 5,276 | 714 | 84.57% | 814 |
| Houston County, AL | 17,355 | 3,759 | 87.25% | 2213 |
| Houston County, GA | 29,008 | 4,949 | 98.69% | 381 |
| Houston County, MN | 2,938 | 235 | 83.80% | 476 |
| Houston County, TN | 1,349 | 311 | 46.89% | 716 |
| Houston County, TX | 3,360 | 1,250 | 58.53% | 1393 |
| Howard County, AR | 2,482 | 650 | 16.52% | 2072 |
| Howard County, IA | 1,637 | 210 | 75.63% | 399 |
| Howard County, IN | 13,282 | 2,337 | 92.40% | 1009 |
| Howard County, MD | 59,154 | 3,389 | 97.42% | 1528 |
| Howard County, MO | 1,548 | 262 | 19.45% | 1247 |
| Howard County, NE | 1,141 | 129 | 43.61% | 643 |
| Howard County, TX | 5,381 | 1,384 | 90.32% | 521 |
| Howell County, MO | 6,813 | 1,951 | 44.94% | 3751 |
| Hubbard County, MN | 3,254 | 537 | 95.88% | 134 |
| Hudson County, NJ | 90,211 | 20,253 | 99.49% | 457 |
| Hudspeth County, TX | 723 | 186 | 40.13% | 433 |
| Huerfano County, CO | 852 | 275 | 57.67% | 361 |
| Hughes County, SD | 3,007 | 346 | 94.85% | 155 |
| Humboldt County, CA | 18,324 | 3,644 | 84.98% | 2752 |
| Humboldt County, IA | 1,616 | 183 | 73.88% | 422 |
| Humboldt County, NV | 3,285 | 542 | 1.08% | 3250 |
| Humphreys County, MS | 1,662 | 865 | 77.91% | 367 |
| Humphreys County, TN | 2,807 | 519 | 47.21% | 1482 |
| Hunt County, TX | 16,600 | 3,319 | 46.96% | 8804 |
| Hunterdon County, NJ | 18,810 | 685 | 98.55% | 273 |
| Huntingdon County, PA | 5,979 | 1,022 | 84.39% | 934 |
| Huntington County, IN | 5,546 | 712 | 79.46% | 1139 |
| Huron County, MI | 4,326 | 740 | 69.71% | 1310 |
| Huron County, OH | 9,989 | 1,321 | 86.57% | 1341 |
| Hutchinson County, SD | 994 | 182 | 99.73% | 3 |
| Hutchinson County, TX | 3,904 | 708 | 89.30% | 418 |
| Hyde County, SD | 185 | 24 | 100.00% | - |
| Iberia Parish, LA | 12,950 | 4,824 | 96.79% | 416 |
| Iberville Parish, LA | 4,834 | 1,593 | 88.41% | 560 |
| Ida County, IA | 1,210 | 140 | 37.54% | 756 |
| Idaho County, ID | 2,434 | 465 | 3.63% | 2346 |
| Imperial County, CA | 36,604 | 11,359 | 87.33% | 4638 |
| Independence County, AR | 6,458 | 1,191 | 65.63% | 2220 |
| Indian River County, FL | 18,267 | 3,075 | 97.70% | 420 |
| Indiana County, PA | 10,893 | 1,818 | 79.79% | 2202 |
| Ingham County, MI | 40,723 | 7,576 | 87.36% | 5149 |
| Inyo County, CA | 2,654 | 390 | 85.35% | 389 |
| Ionia County, MI | 10,245 | 1,237 | 67.91% | 3287 |
| Iosco County, MI | 2,868 | 761 | 86.88% | 376 |
| Iowa County, IA | 2,723 | 196 | 80.98% | 518 |
| Iowa County, WI | 3,992 | 356 | 63.96% | 1439 |
| Iredell County, NC | 30,419 | 3,962 | 98.50% | 456 |
| Irion County, TX | 247 | 23 | 0.00% | 247 |
| Iron County, MI | 1,325 | 286 | 54.93% | 597 |
| Iron County, MO | 1,528 | 413 | 55.95% | 673 |
| Iron County, UT | 10,986 | 1,711 | 89.27% | 1179 |
| Iron County, WI | 677 | 116 | 60.01% | 271 |
| Iroquois County, IL | 4,300 | 644 | 60.38% | 1703 |
| Irwin County, GA | 1,497 | 480 | 63.13% | 552 |
| Isabella County, MI | 8,604 | 1,315 | 81.37% | 1603 |
| Isanti County, MN | 6,820 | 583 | 79.55% | 1395 |
| Island County, WA | 10,308 | 996 | 98.57% | 148 |
| Isle of Wight County, VA | 5,646 | 628 | 85.69% | 808 |
| Itasca County, MN | 6,629 | 1,002 | 88.75% | 746 |
| Itawamba County, MS | 3,725 | 625 | 69.30% | 1143 |
| Izard County, AR | 1,815 | 468 | 53.30% | 848 |
| Jack County, TX | 1,416 | 281 | 17.26% | 1172 |
| Jackson County, AL | 7,859 | 1,801 | 93.03% | 548 |
| Jackson County, AR | 2,358 | 712 | 79.61% | 481 |
| Jackson County, CO | 171 | 36 | 39.89% | 103 |
| Jackson County, FL | 6,263 | 2,099 | 53.19% | 2932 |
| Jackson County, GA | 13,051 | 1,638 | 87.97% | 1571 |
| Jackson County, IA | 3,099 | 417 | 86.07% | 432 |
| Jackson County, IL | 7,014 | 1,929 | 79.90% | 1410 |
| Jackson County, IN | 7,518 | 1,124 | 77.09% | 1723 |
| Jackson County, KS | 2,386 | 335 | 45.85% | 1292 |
| Jackson County, KY | 2,119 | 718 | 99.99% | - |
| Jackson County, MI | 24,335 | 4,371 | 75.52% | 5957 |
| Jackson County, MN | 1,562 | 179 | 71.21% | 450 |
| Jackson County, MO | 115,374 | 20,469 | 98.56% | 1660 |
| Jackson County, MS | 24,854 | 6,308 | 98.87% | 282 |
| Jackson County, NC | 5,094 | 1,040 | 35.46% | 3288 |
| Jackson County, OH | 5,391 | 1,249 | 70.75% | 1577 |
| Jackson County, OK | 4,323 | 994 | 79.18% | 900 |
| Jackson County, OR | 32,182 | 6,186 | 94.14% | 1887 |
| Jackson County, SD | 738 | 281 | 74.17% | 191 |
| Jackson County, TN | 1,513 | 408 | 75.98% | 363 |
| Jackson County, TX | 2,696 | 503 | 71.99% | 755 |
| Jackson County, WI | 3,144 | 511 | 62.34% | 1184 |
| Jackson County, WV | 4,451 | 1,012 | 66.01% | 1513 |
| Jackson Parish, LA | 2,600 | 744 | 62.25% | 982 |
| James City County, VA | 11,356 | 945 | 96.32% | 418 |
| Jasper County, GA | 2,460 | 561 | 79.48% | 505 |
| Jasper County, IA | 6,138 | 609 | 86.35% | 838 |
| Jasper County, IL | 1,600 | 237 | 37.30% | 1003 |
| Jasper County, IN | 5,612 | 638 | 76.83% | 1300 |
| Jasper County, MO | 21,007 | 4,284 | 90.98% | 1895 |
| Jasper County, MS | 2,705 | 742 | 60.54% | 1067 |
| Jasper County, SC | 4,178 | 1,296 | 67.50% | 1358 |
| Jasper County, TX | 6,302 | 1,792 | 50.71% | 3106 |
| Jay County, IN | 3,658 | 692 | 76.57% | 857 |
| Jeff Davis County, GA | 2,870 | 831 | 69.22% | 883 |
| Jefferson County, AL | 106,325 | 22,431 | 99.60% | 425 |
| Jefferson County, AR | 10,629 | 3,438 | 57.23% | 4546 |
| Jefferson County, CO | 83,075 | 6,385 | 97.97% | 1685 |
| Jefferson County, FL | 1,769 | 469 | 35.13% | 1148 |
| Jefferson County, IA | 1,994 | 377 | 77.91% | 440 |
| Jefferson County, ID | 7,472 | 697 | 67.79% | 2407 |
| Jefferson County, IL | 5,839 | 1,310 | 59.47% | 2367 |
| Jefferson County, IN | 4,441 | 970 | 69.34% | 1362 |
| Jefferson County, KS | 3,185 | 293 | 56.48% | 1386 |
| Jefferson County, KY | 118,903 | 26,055 | 99.99% | 10 |
| Jefferson County, MO | 37,647 | 3,542 | 95.26% | 1784 |
| Jefferson County, MS | 1,145 | 595 | 79.63% | 233 |
| Jefferson County, MT | 1,884 | 169 | 42.73% | 1079 |
| Jefferson County, NE | 1,131 | 153 | 65.93% | 385 |
| Jefferson County, NY | 17,557 | 2,643 | 93.36% | 1166 |
| Jefferson County, OH | 9,038 | 2,199 | 87.28% | 1149 |
| Jefferson County, OR | 4,051 | 818 | 63.27% | 1488 |
| Jefferson County, PA | 6,636 | 1,323 | 87.31% | 842 |
| Jefferson County, TN | 7,773 | 1,555 | 85.47% | 1129 |
| Jefferson County, TX | 42,703 | 10,965 | 93.73% | 2679 |
| Jefferson County, WA | 2,726 | 564 | 85.19% | 404 |
| Jefferson County, WI | 12,979 | 1,254 | 86.40% | 1765 |
| Jefferson County, WV | 9,316 | 945 | 96.91% | 288 |
| Jefferson Davis County, MS | 1,595 | 600 | 60.59% | 629 |
| Jefferson Davis Parish, LA | 5,832 | 1,307 | 77.69% | 1301 |
| Jefferson Parish, LA | 66,280 | 15,247 | 98.83% | 778 |
| Jenkins County, GA | 1,267 | 469 | 81.70% | 232 |
| Jennings County, IN | 4,525 | 860 | 66.47% | 1517 |
| Jerauld County, SD | 288 | 58 | 100.00% | - |
| Jerome County, ID | 5,282 | 854 | 66.78% | 1755 |
| Jersey County, IL | 3,268 | 413 | 56.80% | 1412 |
| Jessamine County, KY | 9,246 | 1,374 | 98.13% | 173 |
| Jewell County, KS | 375 | 89 | 89.93% | 38 |
| Jim Wells County, TX | 8,185 | 2,633 | 81.27% | 1533 |
| Jo Daviess County, IL | 3,046 | 326 | 73.49% | 808 |
| Johnson County, AR | 4,690 | 1,519 | 59.09% | 1919 |
| Johnson County, IA | 21,011 | 2,888 | 96.39% | 758 |
| Johnson County, IL | 1,664 | 251 | 18.09% | 1363 |
| Johnson County, IN | 27,745 | 2,687 | 97.56% | 677 |
| Johnson County, KS | 105,912 | 5,476 | 99.33% | 714 |
| Johnson County, KY | 3,597 | 926 | 85.35% | 527 |
| Johnson County, MO | 7,887 | 1,021 | 60.44% | 3120 |
| Johnson County, NE | 706 | 85 | 50.05% | 353 |
| Johnson County, TN | 2,132 | 551 | 94.36% | 120 |
| Johnson County, TX | 32,466 | 4,752 | 85.96% | 4559 |
| Johnson County, WY | 1,420 | 172 | 75.50% | 348 |
| Johnston County, NC | 37,938 | 5,843 | 95.20% | 1821 |
| Johnston County, OK | 1,876 | 443 | 49.46% | 948 |
| Jones County, GA | 5,081 | 914 | 85.03% | 761 |
| Jones County, IA | 3,257 | 401 | 84.38% | 509 |
| Jones County, MS | 12,365 | 3,554 | 77.77% | 2748 |
| Jones County, NC | 1,271 | 366 | 59.43% | 516 |
| Jones County, SD | 147 | 34 | 54.17% | 67 |
| Jones County, TX | 2,492 | 573 | 46.88% | 1324 |
| Josephine County, OR | 11,710 | 2,731 | 77.78% | 2602 |
| Juab County, UT | 2,878 | 294 | 73.83% | 753 |
| Judith Basin County, MT | 286 | 44 | 82.63% | 50 |
| Juneau Borough, AK | 4,848 | 359 | 99.47% | 26 |
| Juneau County, WI | 3,772 | 646 | 68.94% | 1172 |
| Juniata County, PA | 4,033 | 532 | 77.77% | 897 |
| Kalamazoo County, MI | 40,349 | 5,923 | 99.17% | 334 |
| Kalawao County, HI | - | - | 5.56% | - |
| Kalkaska County, MI | 2,719 | 552 | 47.46% | 1429 |
| Kanabec County, MN | 2,523 | 398 | 76.84% | 584 |
| Kanawha County, WV | 25,728 | 5,852 | 95.12% | 1257 |
| Kandiyohi County, MN | 7,338 | 1,200 | 78.20% | 1599 |
| Kane County, IL | 99,798 | 9,968 | 98.88% | 1119 |
| Kane County, UT | 1,333 | 181 | 88.45% | 154 |
| Kankakee County, IL | 18,038 | 3,269 | 88.65% | 2048 |
| Karnes County, TX | 2,395 | 579 | 52.00% | 1150 |
| Kauai County, HI | 11,117 | 1,157 | 92.67% | 815 |
| Kaufman County, TX | 25,742 | 3,457 | 76.07% | 6160 |
| Kay County, OK | 7,807 | 2,236 | 84.18% | 1235 |
| Kearney County, NE | 1,151 | 128 | 86.98% | 150 |
| Kearny County, KS | 810 | 137 | 99.47% | 4 |
| Keith County, NE | 1,115 | 192 | 70.28% | 331 |
| Kenai Peninsula Borough, AK | 9,447 | 1,276 | 49.36% | 4784 |
| Kendall County, IL | 27,503 | 1,284 | 96.24% | 1035 |
| Kendall County, TX | 8,057 | 746 | 92.42% | 611 |
| Kenedy County, TX | 102 | 16 | 6.01% | 96 |
| Kennebec County, ME | 16,746 | 2,239 | 99.45% | 91 |
| Kenosha County, WI | 28,335 | 4,081 | 98.61% | 395 |
| Kent County, DE | 29,095 | 5,325 | 96.06% | 1146 |
| Kent County, MD | 2,195 | 388 | 80.77% | 422 |
| Kent County, MI | 111,596 | 14,938 | 97.67% | 2606 |
| Kent County, RI | 21,954 | 1,989 | 98.54% | 320 |
| Kent County, TX | 104 | 20 | 83.29% | 17 |
| Kenton County, KY | 27,556 | 3,587 | 99.52% | 132 |
| Keokuk County, IA | 1,702 | 274 | 61.17% | 661 |
| Kern County, CA | 186,564 | 49,411 | 94.91% | 9496 |
| Kerr County, TX | 7,070 | 1,563 | 93.35% | 470 |
| Kershaw County, SC | 11,078 | 2,396 | 89.11% | 1206 |
| Ketchikan Gateway Borough, AK | 2,178 | 240 | 99.00% | 22 |
| Kewaunee County, WI | 3,254 | 259 | 45.58% | 1771 |
| Keweenaw County, MI | 222 | 39 | 58.49% | 92 |
| Keya Paha County, NE | 122 | 34 | 96.97% | 4 |
| Kidder County, ND | 365 | 58 | 100.00% | - |
| Kimball County, NE | 539 | 79 | 72.81% | 147 |
| Kimble County, TX | 568 | 200 | 58.04% | 238 |
| King and Queen County, VA | 915 | 162 | 17.74% | 753 |
| King County, TX | 57 | 8 | 66.43% | 19 |
| King County, WA | 317,759 | 31,686 | 98.92% | 3441 |
| King George County, VA | 4,924 | 399 | 92.19% | 384 |
| King William County, VA | 2,836 | 266 | 20.78% | 2247 |
| Kingfisher County, OK | 3,174 | 368 | 64.17% | 1137 |
| Kingman County, KS | 1,125 | 202 | 59.01% | 461 |
| Kings County, CA | 29,249 | 6,565 | 83.98% | 4687 |
| Kings County, NY | 395,532 | 102,497 | 99.97% | 112 |
| Kingsbury County, SD | 758 | 94 | 71.48% | 216 |
| Kinney County, TX | 554 | 131 | 0.00% | 554 |
| Kiowa County, CO | 197 | 39 | 55.44% | 88 |
| Kiowa County, KS | 398 | 62 | 36.31% | 253 |
| Kiowa County, OK | 1,483 | 392 | 71.07% | 429 |
| Kit Carson County, CO | 1,353 | 276 | 57.10% | 580 |
| Kitsap County, WA | 38,595 | 4,063 | 96.87% | 1210 |
| Kittitas County, WA | 5,789 | 683 | 86.82% | 763 |
| Kittson County, MN | 673 | 87 | 44.68% | 372 |
| Klamath County, OR | 10,243 | 2,603 | 76.73% | 2383 |
| Kleberg County, TX | 5,271 | 1,739 | 83.04% | 894 |
| Klickitat County, WA | 3,056 | 536 | 44.39% | 1699 |
| Knott County, KY | 2,147 | 767 | 97.82% | 47 |
| Knox County, IL | 6,771 | 1,397 | 90.77% | 625 |
| Knox County, IN | 5,435 | 1,071 | 86.99% | 707 |
| Knox County, KY | 5,200 | 2,171 | 83.96% | 834 |
| Knox County, ME | 5,117 | 756 | 97.44% | 131 |
| Knox County, MO | 674 | 178 | 6.32% | 631 |
| Knox County, NE | 1,466 | 226 | 63.52% | 535 |
| Knox County, OH | 10,042 | 1,905 | 74.92% | 2519 |
| Knox County, TN | 69,945 | 9,637 | 99.17% | 584 |
| Knox County, TX | 705 | 214 | 100.00% | - |
| Kodiak Island Borough, AK | 2,297 | 202 | 86.50% | 310 |
| Koochiching County, MN | 1,657 | 341 | 76.23% | 394 |
| Kootenai County, ID | 26,650 | 2,928 | 86.77% | 3526 |
| Kosciusko County, IN | 13,325 | 1,541 | 82.35% | 2351 |
| Kossuth County, IA | 2,361 | 266 | 70.60% | 694 |
| Kusilvak Census Area, AK | 2,289 | 1,033 | 0.00% | 2289 |
| La Crosse County, WI | 16,933 | 1,259 | 96.27% | 631 |
| La Paz County, AZ | 2,457 | 792 | 51.57% | 1190 |
| La Plata County, CO | 7,691 | 771 | 66.01% | 2614 |
| La Porte County, IN | 16,465 | 3,791 | 90.86% | 1504 |
| La Salle County, IL | 16,973 | 3,174 | 82.05% | 3046 |
| La Salle County, TX | 1,017 | 375 | 68.20% | 323 |
| La Salle Parish, LA | 2,474 | 565 | 2.67% | 2408 |
| Labette County, KS | 3,302 | 720 | 68.00% | 1057 |
| Lac qui Parle County, MN | 1,006 | 108 | 90.47% | 96 |
| Lackawanna County, PA | 31,316 | 5,422 | 87.86% | 3800 |
| Laclede County, MO | 6,119 | 1,279 | 83.40% | 1016 |
| Lafayette County, FL | 1,372 | 306 | 53.42% | 639 |
| Lafayette County, MO | 5,380 | 725 | 55.32% | 2404 |
| Lafayette County, MS | 7,071 | 1,087 | 89.43% | 748 |
| Lafayette County, WI | 2,938 | 446 | 56.27% | 1285 |
| Lafayette Parish, LA | 40,387 | 7,444 | 98.75% | 506 |
| Lafourche Parish, LA | 16,304 | 3,550 | 90.52% | 1545 |
| Lagrange County, IN | 9,003 | 944 | 36.29% | 5736 |
| Lake and Peninsula Borough, AK | 286 | 72 | 0.00% | 286 |
| Lake County, CA | 9,403 | 2,356 | 92.67% | 689 |
| Lake County, CO | 1,117 | 200 | 91.20% | 98 |
| Lake County, FL | 49,691 | 8,876 | 94.33% | 2818 |
| Lake County, IL | 127,183 | 11,832 | 99.23% | 976 |
| Lake County, IN | 82,534 | 20,785 | 99.22% | 642 |
| Lake County, MN | 1,441 | 148 | 66.03% | 489 |
| Lake County, MT | 5,002 | 1,227 | 69.60% | 1521 |
| Lake County, OH | 34,287 | 3,306 | 99.90% | 36 |
| Lake County, OR | 1,094 | 226 | 42.66% | 627 |
| Lake County, SD | 1,818 | 204 | 90.21% | 178 |
| Lake County, TN | 721 | 291 | 64.57% | 255 |
| Lake of the Woods County, MN | 512 | 66 | 53.25% | 239 |
| Lamar County, AL | 2,182 | 503 | 37.07% | 1373 |
| Lamar County, GA | 2,740 | 650 | 78.93% | 577 |
| Lamar County, MS | 11,303 | 1,977 | 89.26% | 1214 |
| Lamar County, TX | 8,356 | 1,832 | 71.85% | 2352 |
| Lamb County, TX | 2,655 | 729 | 72.12% | 740 |
| Lamoille County, VT | 3,687 | 460 | 88.41% | 427 |
| LaMoure County, ND | 646 | 79 | 100.00% | - |
| Lampasas County, TX | 3,449 | 624 | 30.42% | 2400 |
| Lancaster County, NE | 51,077 | 5,531 | 96.74% | 1666 |
| Lancaster County, PA | 91,228 | 9,101 | 96.20% | 3462 |
| Lancaster County, SC | 14,812 | 2,690 | 88.99% | 1631 |
| Lancaster County, VA | 1,206 | 291 | 70.33% | 358 |
| Lander County, NV | 1,039 | 137 | 0.00% | 1039 |
| Lane County, KS | 247 | 35 | 97.89% | 5 |
| Lane County, OR | 49,467 | 9,842 | 90.47% | 4715 |
| Langlade County, WI | 2,678 | 505 | 54.93% | 1207 |
| Lanier County, GA | 1,742 | 503 | 83.98% | 279 |
| Lapeer County, MI | 13,601 | 1,725 | 74.77% | 3431 |
| Laramie County, WY | 16,423 | 1,880 | 90.41% | 1574 |
| Larimer County, CO | 50,152 | 4,067 | 91.10% | 4464 |
| Larue County, KY | 2,272 | 467 | 87.52% | 283 |
| Las Animas County, CO | 2,003 | 515 | 65.58% | 689 |
| Lassen County, CA | 3,616 | 558 | 43.44% | 2045 |
| Latah County, ID | 5,366 | 492 | 76.92% | 1239 |
| Latimer County, OK | 1,553 | 356 | 43.17% | 883 |
| Lauderdale County, AL | 13,235 | 2,113 | 89.49% | 1391 |
| Lauderdale County, MS | 12,625 | 3,996 | 90.53% | 1196 |
| Lauderdale County, TN | 4,262 | 1,420 | 78.87% | 900 |
| Laurel County, KY | 10,006 | 2,786 | 98.38% | 162 |
| Laurens County, GA | 8,385 | 2,770 | 64.98% | 2937 |
| Laurens County, SC | 10,487 | 2,973 | 85.32% | 1539 |
| Lavaca County, TX | 3,516 | 652 | 46.87% | 1868 |
| Lawrence County, AL | 5,225 | 1,734 | 71.69% | 1479 |
| Lawrence County, AR | 2,578 | 631 | 48.24% | 1334 |
| Lawrence County, IL | 2,085 | 427 | 52.22% | 996 |
| Lawrence County, IN | 7,230 | 1,155 | 85.20% | 1070 |
| Lawrence County, KY | 2,633 | 766 | 100.00% | - |
| Lawrence County, MO | 6,884 | 1,541 | 74.71% | 1741 |
| Lawrence County, MS | 2,250 | 569 | 40.83% | 1331 |
| Lawrence County, OH | 9,425 | 2,195 | 86.59% | 1264 |
| Lawrence County, PA | 12,319 | 2,711 | 95.90% | 505 |
| Lawrence County, SD | 3,365 | 420 | 90.73% | 312 |
| Lawrence County, TN | 7,872 | 1,783 | 52.34% | 3752 |
| Le Flore County, OK | 8,591 | 2,375 | 46.74% | 4576 |
| Le Sueur County, MN | 4,979 | 367 | 81.69% | 912 |
| Lea County, NM | 14,923 | 2,444 | 89.52% | 1563 |
| Leake County, MS | 3,488 | 1,377 | 77.81% | 774 |
| Leavenworth County, KS | 13,725 | 1,602 | 88.11% | 1632 |
| Lebanon County, PA | 23,369 | 2,968 | 98.11% | 442 |
| Lee County, AL | 24,866 | 4,770 | 97.40% | 646 |
| Lee County, FL | 96,029 | 16,040 | 95.41% | 4409 |
| Lee County, GA | 5,832 | 866 | 93.24% | 394 |
| Lee County, IA | 5,054 | 920 | 91.92% | 408 |
| Lee County, IL | 4,842 | 644 | 65.46% | 1672 |
| Lee County, KY | 912 | 391 | 51.46% | 443 |
| Lee County, MS | 15,506 | 2,831 | 90.31% | 1502 |
| Lee County, NC | 10,555 | 2,343 | 97.02% | 315 |
| Lee County, SC | 2,570 | 1,127 | 89.20% | 277 |
| Lee County, TX | 2,542 | 437 | 41.23% | 1494 |
| Lee County, VA | 3,271 | 964 | 89.60% | 340 |
| Leelanau County, MI | 2,530 | 254 | 83.30% | 422 |
| Leflore County, MS | 5,684 | 2,702 | 89.23% | 612 |
| Lehigh County, PA | 60,027 | 9,972 | 99.92% | 47 |
| Lemhi County, ID | 1,080 | 231 | 51.02% | 529 |
| Lenawee County, MI | 14,758 | 1,955 | 78.25% | 3210 |
| Lenoir County, NC | 9,083 | 3,377 | 89.17% | 984 |
| Leon County, FL | 38,625 | 7,270 | 96.01% | 1542 |
| Leon County, TX | 2,795 | 678 | 58.95% | 1147 |
| Leslie County, KY | 1,558 | 602 | 56.09% | 684 |
| Letcher County, KY | 3,330 | 1,197 | 89.23% | 359 |
| Levy County, FL | 5,738 | 1,472 | 27.38% | 4167 |
| Lewis and Clark County, MT | 10,383 | 1,217 | 85.98% | 1456 |
| Lewis County, ID | 664 | 136 | 21.49% | 521 |
| Lewis County, KY | 2,047 | 604 | 75.86% | 494 |
| Lewis County, MO | 1,568 | 320 | 40.46% | 934 |
| Lewis County, NY | 4,274 | 743 | 76.32% | 1012 |
| Lewis County, TN | 1,896 | 464 | 56.34% | 828 |
| Lewis County, WA | 11,891 | 1,787 | 65.53% | 4099 |
| Lewis County, WV | 2,422 | 587 | 72.90% | 656 |
| Lexington city, VA | 559 | 57 | 99.91% | - |
| Lexington County, SC | 50,529 | 8,100 | 96.19% | 1923 |
| Liberty County, FL | 1,042 | 278 | 33.04% | 698 |
| Liberty County, GA | 10,650 | 2,434 | 95.58% | 471 |
| Liberty County, MT | 297 | 75 | 84.01% | 47 |
| Liberty County, TX | 16,300 | 3,749 | 72.77% | 4438 |
| Licking County, OH | 29,358 | 3,215 | 95.24% | 1398 |
| Limestone County, AL | 16,020 | 2,529 | 94.71% | 848 |
| Limestone County, TX | 3,687 | 1,160 | 71.93% | 1035 |
| Lincoln County, AR | 1,682 | 423 | 12.82% | 1466 |
| Lincoln County, CO | 797 | 166 | 19.50% | 642 |
| Lincoln County, GA | 1,052 | 267 | 100.00% | - |
| Lincoln County, ID | 1,163 | 217 | 37.23% | 730 |
| Lincoln County, KS | 499 | 84 | 27.49% | 362 |
| Lincoln County, KY | 4,089 | 1,140 | 78.98% | 860 |
| Lincoln County, ME | 4,102 | 589 | 97.32% | 110 |
| Lincoln County, MN | 974 | 106 | 56.16% | 427 |
| Lincoln County, MO | 10,338 | 1,537 | 81.71% | 1890 |
| Lincoln County, MS | 5,810 | 1,366 | 85.88% | 821 |
| Lincoln County, NC | 12,959 | 1,748 | 99.52% | 63 |
| Lincoln County, NE | 5,989 | 742 | 85.67% | 858 |
| Lincoln County, NM | 2,589 | 693 | 83.61% | 424 |
| Lincoln County, NV | 739 | 111 | 83.57% | 121 |
| Lincoln County, OK | 6,103 | 1,155 | 40.61% | 3625 |
| Lincoln County, OR | 5,879 | 1,137 | 95.32% | 275 |
| Lincoln County, SD | 12,025 | 399 | 90.98% | 1085 |
| Lincoln County, TN | 5,592 | 970 | 83.12% | 944 |
| Lincoln County, WA | 1,755 | 250 | 81.31% | 328 |
| Lincoln County, WI | 3,533 | 429 | 60.86% | 1383 |
| Lincoln County, WV | 3,283 | 888 | 78.88% | 693 |
| Lincoln County, WY | 3,783 | 310 | 69.70% | 1146 |
| Lincoln Parish, LA | 6,564 | 1,922 | 86.61% | 879 |
| Linn County, IA | 37,008 | 3,953 | 97.86% | 792 |
| Linn County, KS | 1,623 | 253 | 53.03% | 762 |
| Linn County, MO | 2,042 | 475 | 67.59% | 662 |
| Linn County, OR | 20,212 | 3,091 | 85.74% | 2882 |
| Lipscomb County, TX | 654 | 107 | 81.10% | 124 |
| Litchfield County, CT | 25,011 | 1,722 | 99.78% | 56 |
| Little River County, AR | 1,972 | 448 | 54.04% | 906 |
| Live Oak County, TX | 1,734 | 415 | 64.70% | 612 |
| Livingston County, IL | 5,578 | 832 | 73.02% | 1505 |
| Livingston County, KY | 1,333 | 294 | 72.06% | 372 |
| Livingston County, MI | 30,441 | 1,490 | 94.76% | 1594 |
| Livingston County, MO | 2,258 | 445 | 73.51% | 598 |
| Livingston County, NY | 8,210 | 1,014 | 87.40% | 1035 |
| Livingston Parish, LA | 25,693 | 3,546 | 98.81% | 307 |
| Llano County, TX | 2,347 | 533 | 1.17% | 2320 |
| Logan County, AR | 3,201 | 882 | 20.07% | 2558 |
| Logan County, CO | 2,759 | 468 | 86.66% | 368 |
| Logan County, IL | 3,928 | 642 | 79.62% | 801 |
| Logan County, KS | 459 | 70 | 89.08% | 50 |
| Logan County, KY | 4,422 | 1,114 | 73.96% | 1151 |
| Logan County, ND | 311 | 53 | 100.00% | - |
| Logan County, NE | 137 | 15 | 44.43% | 76 |
| Logan County, OH | 7,469 | 1,086 | 81.99% | 1345 |
| Logan County, OK | 7,826 | 1,035 | 79.91% | 1572 |
| Logan County, WV | 4,783 | 1,461 | 72.42% | 1319 |
| Long County, GA | 3,643 | 808 | 89.19% | 394 |
| Lonoke County, AR | 13,774 | 1,998 | 85.69% | 1972 |
| Lorain County, OH | 49,806 | 9,451 | 90.62% | 4671 |
| Los Alamos County, NM | 3,191 | 85 | 98.92% | 34 |
| Los Angeles County, CA | 1,558,359 | 304,157 | 99.69% | 4866 |
| Loudon County, TN | 7,344 | 1,108 | 93.68% | 464 |
| Loudoun County, VA | 85,278 | 2,617 | 96.38% | 3087 |
| Louisa County, IA | 1,795 | 224 | 77.11% | 411 |
| Louisa County, VA | 5,303 | 695 | 36.25% | 3381 |
| Loup County, NE | 85 | 21 | 2.85% | 83 |
| Love County, OK | 1,779 | 366 | 31.01% | 1227 |
| Loving County, TX | 41 | 3 | 69.51% | 13 |
| Lowndes County, GA | 19,502 | 6,435 | 95.42% | 893 |
| Lowndes County, MS | 9,973 | 3,286 | 89.55% | 1043 |
| Lubbock County, TX | 51,656 | 9,991 | 93.46% | 3379 |
| Lucas County, IA | 1,397 | 343 | 70.40% | 414 |
| Lucas County, OH | 69,625 | 16,302 | 98.43% | 1092 |
| Luce County, MI | 754 | 191 | 1.48% | 743 |
| Lumpkin County, GA | 4,164 | 733 | 81.34% | 777 |
| Luna County, NM | 4,313 | 1,698 | 63.14% | 1590 |
| Lunenburg County, VA | 1,616 | 376 | 30.36% | 1125 |
| Luzerne County, PA | 45,098 | 9,387 | 96.51% | 1575 |
| Lycoming County, PA | 16,700 | 2,812 | 91.55% | 1411 |
| Lyman County, SD | 746 | 224 | 78.48% | 161 |
| Lynchburg city, VA | 10,435 | 2,600 | 89.69% | 1076 |
| Lynn County, TX | 1,153 | 300 | 80.32% | 227 |
| Lyon County, IA | 2,418 | 222 | 84.16% | 383 |
| Lyon County, KS | 5,293 | 712 | 78.50% | 1138 |
| Lyon County, KY | 847 | 159 | 28.52% | 605 |
| Lyon County, MN | 4,634 | 576 | 79.31% | 959 |
| Lyon County, NV | 8,560 | 1,471 | 74.49% | 2183 |
| Mackinac County, MI | 1,222 | 242 | 61.88% | 466 |
| Macomb County, MI | 133,846 | 19,560 | 98.95% | 1410 |
| Macon County, AL | 2,182 | 852 | 69.80% | 659 |
| Macon County, GA | 1,771 | 683 | 66.98% | 585 |
| Macon County, IL | 16,316 | 4,124 | 90.07% | 1620 |
| Macon County, MO | 2,543 | 508 | 76.76% | 591 |
| Macon County, NC | 4,641 | 1,232 | 57.95% | 1951 |
| Macon County, TN | 4,161 | 994 | 93.44% | 273 |
| Macoupin County, IL | 7,040 | 1,247 | 75.38% | 1733 |
| Madera County, CA | 30,782 | 8,472 | 72.06% | 8599 |
| Madison County, AL | 57,692 | 8,794 | 98.16% | 1062 |
| Madison County, AR | 2,720 | 700 | 44.17% | 1519 |
| Madison County, FL | 2,377 | 764 | 63.80% | 861 |
| Madison County, GA | 4,948 | 1,156 | 84.05% | 789 |
| Madison County, IA | 3,055 | 204 | 83.37% | 508 |
| Madison County, ID | 6,742 | 1,085 | 80.77% | 1297 |
| Madison County, IL | 41,750 | 6,812 | 98.16% | 770 |
| Madison County, IN | 19,817 | 4,227 | 89.18% | 2145 |
| Madison County, KY | 13,514 | 2,013 | 96.35% | 493 |
| Madison County, MO | 1,970 | 453 | 55.26% | 881 |
| Madison County, MS | 19,628 | 2,561 | 95.47% | 890 |
| Madison County, MT | 996 | 134 | 30.75% | 690 |
| Madison County, NC | 2,771 | 622 | 52.34% | 1321 |
| Madison County, NE | 6,178 | 709 | 89.60% | 642 |
| Madison County, NY | 9,875 | 1,308 | 91.26% | 863 |
| Madison County, OH | 6,620 | 845 | 91.46% | 565 |
| Madison County, TN | 15,577 | 3,884 | 94.30% | 888 |
| Madison County, TX | 2,248 | 499 | 15.57% | 1898 |
| Madison County, VA | 2,008 | 289 | 52.72% | 949 |
| Madison Parish, LA | 1,863 | 1,013 | 68.33% | 590 |
| Magoffin County, KY | 1,997 | 714 | 100.00% | - |
| Mahaska County, IA | 3,736 | 497 | 81.30% | 699 |
| Mahnomen County, MN | 1,231 | 339 | 81.51% | 228 |
| Mahoning County, OH | 33,159 | 7,155 | 99.31% | 227 |
| Major County, OK | 1,397 | 190 | 23.97% | 1062 |
| Malheur County, OR | 5,693 | 1,607 | 63.16% | 2097 |
| Manassas city, VA | 7,455 | 1,081 | 98.29% | 128 |
| Manassas Park city, VA | 3,170 | 305 | 99.93% | 2 |
| Manatee County, FL | 52,213 | 8,459 | 99.47% | 276 |
| Manistee County, MI | 3,067 | 602 | 64.50% | 1089 |
| Manitowoc County, WI | 11,852 | 1,452 | 86.41% | 1611 |
| Marathon County, WI | 22,311 | 1,815 | 76.24% | 5301 |
| Maricopa County, AZ | 758,825 | 128,666 | 94.45% | 42117 |
| Maries County, MO | 1,341 | 241 | 26.16% | 990 |
| Marin County, CA | 39,621 | 2,303 | 96.11% | 1541 |
| Marinette County, WI | 5,626 | 861 | 63.98% | 2027 |
| Marion County, AL | 4,491 | 1,161 | 84.28% | 706 |
| Marion County, AR | 2,211 | 668 | 58.58% | 916 |
| Marion County, FL | 47,922 | 12,132 | 93.24% | 3241 |
| Marion County, GA | 1,332 | 457 | 67.58% | 432 |
| Marion County, IA | 5,838 | 503 | 88.76% | 656 |
| Marion County, IL | 6,095 | 1,738 | 76.93% | 1406 |
| Marion County, IN | 161,701 | 36,801 | 98.96% | 1686 |
| Marion County, KS | 1,864 | 210 | 68.48% | 587 |
| Marion County, KY | 3,408 | 726 | 85.73% | 486 |
| Marion County, MO | 4,651 | 823 | 87.04% | 603 |
| Marion County, MS | 4,230 | 1,505 | 64.21% | 1514 |
| Marion County, OH | 9,561 | 2,271 | 90.68% | 891 |
| Marion County, OR | 60,497 | 10,357 | 94.36% | 3414 |
| Marion County, SC | 5,200 | 1,835 | 71.27% | 1494 |
| Marion County, TN | 4,312 | 962 | 85.61% | 620 |
| Marion County, TX | 1,329 | 431 | 60.98% | 519 |
| Marion County, WV | 7,889 | 1,628 | 90.04% | 786 |
| Mariposa County, CA | 2,044 | 447 | 10.24% | 1835 |
| Marquette County, MI | 8,547 | 1,103 | 90.15% | 842 |
| Marquette County, WI | 2,122 | 330 | 72.29% | 588 |
| Marshall County, AL | 16,782 | 4,510 | 95.88% | 691 |
| Marshall County, IA | 7,277 | 952 | 86.24% | 1001 |
| Marshall County, IL | 1,659 | 195 | 72.06% | 464 |
| Marshall County, IN | 8,411 | 1,067 | 68.63% | 2639 |
| Marshall County, KS | 1,651 | 243 | 42.84% | 944 |
| Marshall County, KY | 4,612 | 765 | 98.48% | 70 |
| Marshall County, MN | 1,513 | 135 | 50.16% | 754 |
| Marshall County, MS | 5,391 | 1,776 | 77.50% | 1213 |
| Marshall County, OK | 2,719 | 680 | 52.08% | 1303 |
| Marshall County, SD | 643 | 125 | 96.35% | 23 |
| Marshall County, TN | 5,670 | 1,031 | 85.33% | 832 |
| Marshall County, WV | 4,307 | 778 | 79.94% | 864 |
| Martin County, FL | 19,419 | 2,917 | 98.50% | 292 |
| Martin County, IN | 1,616 | 240 | 61.16% | 628 |
| Martin County, KY | 1,652 | 664 | 78.31% | 358 |
| Martin County, MN | 3,095 | 560 | 58.32% | 1290 |
| Martin County, NC | 3,283 | 992 | 81.22% | 617 |
| Martin County, TX | 1,272 | 238 | 87.14% | 164 |
| Martinsville city, VA | 2,201 | 742 | 99.19% | 18 |
| Mason County, IL | 2,062 | 457 | 66.56% | 689 |
| Mason County, KY | 2,867 | 646 | 82.50% | 502 |
| Mason County, MI | 4,220 | 662 | 66.18% | 1427 |
| Mason County, TX | 642 | 148 | 69.37% | 197 |
| Mason County, WA | 8,892 | 1,876 | 90.47% | 847 |
| Mason County, WV | 4,037 | 941 | 53.48% | 1878 |
| Massac County, IL | 2,282 | 515 | 62.32% | 860 |
| Matagorda County, TX | 6,634 | 1,871 | 79.79% | 1341 |
| Matanuska-Susitna Borough, AK | 20,626 | 2,142 | 92.61% | 1524 |
| Mathews County, VA | 1,021 | 157 | 91.89% | 83 |
| Maui County, HI | 25,995 | 2,370 | 95.24% | 1238 |
| Maury County, TN | 15,466 | 2,028 | 94.73% | 815 |
| Maverick County, TX | 12,796 | 4,534 | 97.43% | 328 |
| Mayes County, OK | 6,901 | 1,319 | 74.51% | 1759 |
| Mc Kean County, PA | 5,835 | 1,506 | 89.06% | 639 |
| McClain County, OK | 7,779 | 864 | 74.63% | 1973 |
| McCone County, MT | 241 | 41 | 48.33% | 125 |
| McCook County, SD | 1,058 | 134 | 76.52% | 248 |
| McCracken County, KY | 10,326 | 2,096 | 98.13% | 193 |
| McCreary County, KY | 2,599 | 1,000 | 100.00% | - |
| McCulloch County, TX | 1,306 | 333 | 1.74% | 1283 |
| McCurtain County, OK | 5,849 | 1,460 | 14.99% | 4972 |
| McDonald County, MO | 4,104 | 1,056 | 72.88% | 1113 |
| McDonough County, IL | 3,691 | 774 | 96.13% | 143 |
| McDowell County, NC | 6,610 | 1,326 | 77.78% | 1469 |
| McDowell County, WV | 2,703 | 1,089 | 82.46% | 474 |
| McDuffie County, GA | 3,936 | 1,203 | 82.37% | 694 |
| McHenry County, IL | 54,931 | 4,003 | 97.88% | 1167 |
| McHenry County, ND | 1,017 | 108 | 77.41% | 230 |
| McIntosh County, GA | 1,690 | 589 | 97.57% | 41 |
| McIntosh County, ND | 358 | 56 | 100.00% | - |
| McKenzie County, ND | 2,889 | 271 | 85.19% | 428 |
| McLean County, IL | 26,630 | 2,293 | 92.91% | 1887 |
| McLean County, KY | 1,629 | 267 | 57.35% | 695 |
| McLean County, ND | 1,455 | 143 | 96.34% | 53 |
| McLennan County, TX | 43,892 | 9,816 | 88.06% | 5240 |
| McLeod County, MN | 5,987 | 488 | 75.25% | 1482 |
| McMinn County, TN | 8,191 | 1,683 | 85.51% | 1187 |
| McMullen County, TX | 101 | 15 | 62.52% | 38 |
| McNairy County, TN | 4,191 | 871 | 53.88% | 1933 |
| McPherson County, KS | 4,822 | 427 | 77.77% | 1072 |
| McPherson County, NE | 73 | 11 | 46.20% | 39 |
| McPherson County, SD | 318 | 72 | 77.88% | 70 |
| Meade County, KS | 777 | 97 | 0.00% | 777 |
| Meade County, KY | 4,758 | 685 | 100.00% | - |
| Meade County, SD | 4,846 | 493 | 88.51% | 557 |
| Meagher County, MT | 212 | 66 | 98.47% | 3 |
| Mecklenburg County, NC | 181,207 | 29,702 | 100.00% | 3 |
| Mecosta County, MI | 5,747 | 1,004 | 76.37% | 1358 |
| Medina County, OH | 29,937 | 1,996 | 98.37% | 488 |
| Medina County, TX | 8,551 | 1,501 | 54.31% | 3907 |
| Meeker County, MN | 4,077 | 344 | 72.14% | 1136 |
| Meigs County, OH | 3,608 | 858 | 60.86% | 1412 |
| Meigs County, TN | 1,826 | 445 | 77.42% | 412 |
| Mellette County, SD | 404 | 161 | 60.69% | 159 |
| Menard County, IL | 1,979 | 272 | 53.67% | 917 |
| Mendocino County, CA | 13,104 | 2,900 | 76.22% | 3116 |
| Menifee County, KY | 791 | 308 | 66.40% | 266 |
| Menominee County, MI | 3,047 | 473 | 72.52% | 837 |
| Menominee County, WI | 1,090 | 462 | 51.61% | 527 |
| Merced County, CA | 58,560 | 16,177 | 89.85% | 5946 |
| Mercer County, IL | 2,490 | 291 | 62.79% | 927 |
| Mercer County, KY | 3,409 | 672 | 80.13% | 677 |
| Mercer County, MO | 621 | 119 | 68.43% | 196 |
| Mercer County, ND | 1,368 | 81 | 100.00% | - |
| Mercer County, NJ | 56,993 | 7,508 | 98.12% | 1073 |
| Mercer County, OH | 7,350 | 740 | 86.10% | 1022 |
| Mercer County, PA | 15,067 | 3,580 | 89.56% | 1573 |
| Mercer County, WV | 8,597 | 3,147 | 90.42% | 824 |
| Meriwether County, GA | 3,164 | 1,215 | 62.45% | 1188 |
| Merrick County, NE | 1,229 | 161 | 58.92% | 505 |
| Merrimack County, NH | 21,021 | 1,817 | 97.03% | 624 |
| Mesa County, CO | 23,746 | 4,710 | 92.30% | 1828 |
| Metcalfe County, KY | 1,679 | 584 | 79.26% | 348 |
| Miami County, IN | 5,459 | 1,012 | 68.12% | 1740 |
| Miami County, KS | 6,070 | 546 | 65.38% | 2101 |
| Miami County, OH | 17,481 | 1,875 | 96.16% | 671 |
| Miami-Dade County, FL | 392,379 | 85,815 | 98.63% | 5357 |
| Middlesex County, CT | 21,698 | 1,580 | 99.28% | 156 |
| Middlesex County, MA | 229,986 | 16,477 | 98.49% | 3465 |
| Middlesex County, NJ | 130,953 | 13,110 | 99.24% | 999 |
| Middlesex County, VA | 1,226 | 276 | 87.21% | 157 |
| Midland County, MI | 12,864 | 1,569 | 93.17% | 879 |
| Midland County, TX | 33,605 | 4,635 | 97.02% | 1000 |
| Mifflin County, PA | 7,266 | 1,553 | 88.50% | 836 |
| Milam County, TX | 4,435 | 1,091 | 52.35% | 2113 |
| Millard County, UT | 2,934 | 388 | 58.86% | 1207 |
| Mille Lacs County, MN | 4,359 | 657 | 60.63% | 1716 |
| Miller County, AR | 7,207 | 2,321 | 91.85% | 587 |
| Miller County, GA | 968 | 286 | 64.16% | 347 |
| Miller County, MO | 4,205 | 971 | 55.86% | 1856 |
| Mills County, IA | 2,605 | 240 | 77.66% | 582 |
| Mills County, TX | 697 | 158 | 69.06% | 216 |
| Milwaukee County, WI | 159,093 | 40,314 | 99.99% | 16 |
| Miner County, SD | 375 | 47 | 100.00% | - |
| Mineral County, CO | 79 | 13 | 81.46% | 15 |
| Mineral County, MT | 551 | 127 | 24.86% | 414 |
| Mineral County, NV | 608 | 151 | 70.87% | 177 |
| Mineral County, WV | 3,810 | 734 | 70.82% | 1112 |
| Mingo County, WV | 3,783 | 1,330 | 71.21% | 1089 |
| Minidoka County, ID | 4,182 | 650 | 57.89% | 1761 |
| Minnehaha County, SD | 33,435 | 2,819 | 98.48% | 508 |
| Missaukee County, MI | 2,453 | 499 | 26.33% | 1807 |
| Mississippi County, AR | 7,592 | 2,658 | 74.32% | 1950 |
| Mississippi County, MO | 2,062 | 673 | 86.08% | 287 |
| Missoula County, MT | 15,799 | 1,841 | 90.29% | 1534 |
| Mitchell County, GA | 3,651 | 1,353 | 62.86% | 1356 |
| Mitchell County, IA | 1,857 | 214 | 87.56% | 231 |
| Mitchell County, KS | 972 | 174 | 90.52% | 92 |
| Mitchell County, NC | 1,990 | 462 | 90.17% | 196 |
| Mitchell County, TX | 1,256 | 324 | 6.70% | 1172 |
| Mobile County, AL | 68,382 | 20,805 | 96.71% | 2251 |
| Modoc County, CA | 1,195 | 305 | 4.84% | 1137 |
| Moffat County, CO | 2,443 | 383 | 77.58% | 548 |
| Mohave County, AZ | 25,718 | 6,604 | 80.60% | 4990 |
| Moniteau County, MO | 2,859 | 410 | 98.63% | 39 |
| Monmouth County, NJ | 100,280 | 8,860 | 99.78% | 223 |
| Mono County, CA | 1,892 | 212 | 78.51% | 407 |
| Monona County, IA | 1,372 | 224 | 63.68% | 498 |
| Monongalia County, WV | 11,699 | 1,572 | 54.23% | 5354 |
| Monroe County, AL | 3,381 | 1,019 | 62.89% | 1255 |
| Monroe County, FL | 7,739 | 1,552 | 97.03% | 230 |
| Monroe County, GA | 4,110 | 697 | 72.64% | 1125 |
| Monroe County, IA | 1,372 | 203 | 75.42% | 337 |
| Monroe County, IL | 5,588 | 197 | 89.20% | 604 |
| Monroe County, IN | 16,058 | 2,031 | 98.96% | 166 |
| Monroe County, KY | 1,681 | 582 | 88.35% | 196 |
| Monroe County, MI | 23,685 | 2,963 | 94.29% | 1352 |
| Monroe County, MO | 1,344 | 289 | 55.53% | 598 |
| Monroe County, MS | 5,988 | 1,469 | 75.50% | 1467 |
| Monroe County, NY | 111,551 | 20,401 | 99.95% | 56 |
| Monroe County, OH | 2,038 | 361 | 0.00% | 2038 |
| Monroe County, PA | 25,119 | 3,625 | 99.07% | 234 |
| Monroe County, TN | 7,090 | 1,519 | 73.48% | 1880 |
| Monroe County, WI | 8,300 | 1,535 | 73.59% | 2192 |
| Monroe County, WV | 1,958 | 409 | 27.79% | 1414 |
| Montague County, TX | 3,223 | 640 | 58.49% | 1338 |
| Montcalm County, MI | 10,187 | 1,872 | 70.18% | 3038 |
| Monterey County, CA | 81,081 | 15,435 | 93.64% | 5158 |
| Montezuma County, CO | 4,234 | 1,205 | 59.43% | 1718 |
| Montgomery County, AL | 36,808 | 11,756 | 97.93% | 763 |
| Montgomery County, GA | 1,348 | 367 | 40.05% | 808 |
| Montgomery County, IA | 1,597 | 329 | 91.16% | 141 |
| Montgomery County, IL | 4,153 | 736 | 68.17% | 1322 |
| Montgomery County, IN | 6,346 | 936 | 70.39% | 1879 |
| Montgomery County, KS | 5,477 | 1,475 | 75.48% | 1343 |
| Montgomery County, KY | 4,595 | 894 | 93.48% | 299 |
| Montgomery County, MD | 176,633 | 14,622 | 98.80% | 2122 |
| Montgomery County, MO | 1,823 | 373 | 57.46% | 775 |
| Montgomery County, MS | 1,658 | 576 | 77.21% | 378 |
| Montgomery County, NC | 4,368 | 1,053 | 59.45% | 1771 |
| Montgomery County, NY | 7,931 | 1,788 | 92.76% | 574 |
| Montgomery County, OH | 83,158 | 18,085 | 99.65% | 289 |
| Montgomery County, PA | 130,536 | 8,679 | 99.07% | 1214 |
| Montgomery County, TN | 37,294 | 5,959 | 98.10% | 709 |
| Montgomery County, TX | 114,082 | 13,509 | 96.13% | 4416 |
| Montgomery County, VA | 10,785 | 1,441 | 90.00% | 1079 |
| Montour County, PA | 2,551 | 340 | 72.31% | 706 |
| Montrose County, CO | 6,648 | 1,107 | 72.77% | 1810 |
| Moody County, SD | 1,174 | 128 | 69.57% | 357 |
| Moore County, NC | 14,944 | 2,104 | 90.78% | 1378 |
| Moore County, TN | 929 | 121 | 66.21% | 314 |
| Moore County, TX | 4,668 | 766 | 90.84% | 428 |
| Morehouse Parish, LA | 4,339 | 1,804 | 92.26% | 336 |
| Morgan County, AL | 19,704 | 3,654 | 92.06% | 1565 |
| Morgan County, CO | 5,251 | 803 | 86.14% | 728 |
| Morgan County, GA | 3,115 | 603 | 70.98% | 904 |
| Morgan County, IL | 4,559 | 974 | 68.71% | 1427 |
| Morgan County, IN | 11,530 | 1,676 | 92.57% | 857 |
| Morgan County, KY | 1,700 | 514 | 77.11% | 389 |
| Morgan County, MO | 3,261 | 803 | 95.56% | 145 |
| Morgan County, OH | 2,256 | 511 | 57.99% | 948 |
| Morgan County, TN | 3,026 | 724 | 100.00% | - |
| Morgan County, UT | 3,353 | 110 | 91.72% | 278 |
| Morgan County, WV | 2,396 | 426 | 68.57% | 753 |
| Morrill County, NE | 806 | 135 | 58.77% | 332 |
| Morris County, KS | 817 | 135 | 98.11% | 15 |
| Morris County, NJ | 79,003 | 3,772 | 99.98% | 12 |
| Morris County, TX | 2,084 | 624 | 68.25% | 662 |
| Morrison County, MN | 5,635 | 622 | 70.90% | 1640 |
| Morrow County, OH | 5,947 | 887 | 73.22% | 1593 |
| Morrow County, OR | 2,265 | 428 | 68.79% | 707 |
| Morton County, KS | 497 | 72 | 100.00% | - |
| Morton County, ND | 4,869 | 447 | 95.67% | 211 |
| Motley County, TX | 181 | 53 | 94.13% | 11 |
| Moultrie County, IL | 2,715 | 343 | 69.53% | 827 |
| Mountrail County, ND | 1,846 | 229 | 91.66% | 154 |
| Mower County, MN | 7,188 | 911 | 78.48% | 1547 |
| Muhlenberg County, KY | 4,450 | 1,008 | 80.53% | 866 |
| Multnomah County, OR | 106,045 | 14,165 | 98.47% | 1618 |
| Murray County, GA | 7,143 | 1,502 | 98.14% | 133 |
| Murray County, MN | 1,294 | 140 | 53.28% | 605 |
| Murray County, OK | 2,392 | 441 | 62.93% | 887 |
| Muscatine County, IA | 7,608 | 1,118 | 87.60% | 943 |
| Muscogee County, GA | 33,530 | 9,022 | 99.47% | 177 |
| Muskegon County, MI | 28,653 | 6,018 | 94.09% | 1693 |
| Muskingum County, OH | 13,838 | 3,030 | 90.16% | 1361 |
| Muskogee County, OK | 11,861 | 2,136 | 75.53% | 2902 |
| Musselshell County, MT | 625 | 160 | 52.29% | 298 |
| Nacogdoches County, TX | 10,819 | 2,811 | 82.91% | 1849 |
| Nance County, NE | 581 | 72 | 49.40% | 294 |
| Nantucket County, MA | 1,640 | 89 | 99.68% | 5 |
| Napa County, CA | 21,351 | 1,863 | 94.84% | 1102 |
| Nash County, NC | 15,087 | 3,122 | 93.45% | 988 |
| Nassau County, FL | 12,347 | 1,544 | 94.70% | 654 |
| Nassau County, NY | 213,975 | 15,216 | 100.00% | - |
| Natchitoches Parish, LA | 6,464 | 1,917 | 70.83% | 1885 |
| Natrona County, WY | 13,404 | 1,591 | 92.40% | 1018 |
| Navarro County, TX | 9,239 | 2,350 | 64.25% | 3303 |
| Nelson County, KY | 7,733 | 1,122 | 96.46% | 274 |
| Nelson County, ND | 407 | 39 | 100.00% | - |
| Nelson County, VA | 1,967 | 364 | 38.07% | 1218 |
| Nemaha County, KS | 1,865 | 195 | 64.30% | 666 |
| Nemaha County, NE | 1,069 | 131 | 75.12% | 266 |
| Neosho County, KS | 2,756 | 593 | 70.48% | 814 |
| Neshoba County, MS | 5,962 | 2,116 | 76.44% | 1405 |
| Ness County, KS | 444 | 58 | 75.70% | 108 |
| Nevada County, AR | 1,376 | 386 | 50.02% | 688 |
| Nevada County, CA | 12,474 | 1,596 | 80.66% | 2412 |
| New Castle County, DE | 86,531 | 12,220 | 98.39% | 1397 |
| New Hanover County, NC | 30,658 | 6,144 | 99.93% | 22 |
| New Haven County, CT | 126,823 | 19,709 | 99.65% | 438 |
| New Kent County, VA | 3,215 | 223 | 79.81% | 649 |
| New London County, CT | 37,796 | 4,635 | 97.56% | 923 |
| New Madrid County, MO | 2,873 | 682 | 78.97% | 604 |
| New York County, NY | 153,377 | 29,138 | 99.92% | 128 |
| Newaygo County, MI | 7,902 | 1,628 | 47.90% | 4117 |
| Newberry County, SC | 6,013 | 1,439 | 81.31% | 1124 |
| Newport County, RI | 10,246 | 932 | 96.10% | 400 |
| Newport News city, VA | 27,581 | 6,329 | 98.15% | 511 |
| Newton County, GA | 20,958 | 4,470 | 98.75% | 261 |
| Newton County, IN | 2,146 | 284 | 90.35% | 207 |
| Newton County, MO | 9,968 | 2,155 | 79.72% | 2021 |
| Newton County, TX | 2,070 | 557 | 25.95% | 1533 |
| Nez Perce County, ID | 5,940 | 802 | 85.97% | 833 |
| Niagara County, NY | 30,350 | 5,386 | 99.06% | 286 |
| Nicholas County, KY | 1,207 | 331 | 43.80% | 678 |
| Nicholas County, WV | 3,686 | 900 | 55.77% | 1630 |
| Nicollet County, MN | 5,443 | 430 | 85.33% | 798 |
| Niobrara County, WY | 289 | 46 | 4.31% | 277 |
| Noble County, IN | 8,278 | 923 | 73.29% | 2211 |
| Noble County, OH | 1,895 | 345 | 51.25% | 924 |
| Noble County, OK | 1,923 | 281 | 60.59% | 758 |
| Nobles County, MN | 4,080 | 564 | 75.45% | 1002 |
| Nodaway County, MO | 2,311 | 316 | 92.81% | 166 |
| Nolan County, TX | 2,779 | 703 | 78.43% | 599 |
| Nome Census Area, AK | 2,413 | 617 | 0.00% | 2413 |
| Norfolk city, VA | 31,085 | 8,618 | 95.87% | 1284 |
| Norfolk County, MA | 108,915 | 5,957 | 98.09% | 2083 |
| Norman County, MN | 1,149 | 172 | 90.91% | 104 |
| North Slope Borough, AK | 1,793 | 260 | 0.00% | 1793 |
| Northampton County, NC | 2,463 | 855 | 83.95% | 395 |
| Northampton County, PA | 45,240 | 6,120 | 99.99% | 5 |
| Northampton County, VA | 1,723 | 465 | 71.45% | 492 |
| Northumberland County, PA | 12,591 | 2,177 | 83.65% | 2059 |
| Northumberland County, VA | 1,326 | 324 | 81.86% | 241 |
| Northwest Arctic Borough, AK | 1,904 | 481 | 0.00% | 1904 |
| Norton city, VA | 569 | 163 | 97.63% | 14 |
| Norton County, KS | 722 | 134 | 88.36% | 84 |
| Nottoway County, VA | 2,147 | 556 | 57.24% | 918 |
| Nowata County, OK | 1,701 | 404 | 41.28% | 999 |
| Noxubee County, MS | 1,804 | 730 | 69.62% | 548 |
| Nuckolls County, NE | 610 | 96 | 63.00% | 226 |
| Nueces County, TX | 63,435 | 12,857 | 97.47% | 1603 |
| Nye County, NV | 5,459 | 1,273 | 45.66% | 2967 |
| Oakland County, MI | 192,559 | 17,307 | 99.40% | 1161 |
| Obion County, TN | 4,781 | 1,160 | 72.87% | 1297 |
| O'Brien County, IA | 2,352 | 235 | 88.07% | 280 |
| Ocean County, NJ | 100,550 | 15,345 | 98.91% | 1099 |
| Oceana County, MI | 4,416 | 939 | 37.51% | 2759 |
| Ochiltree County, TX | 2,252 | 340 | 90.77% | 208 |
| Oconee County, GA | 8,258 | 493 | 97.70% | 190 |
| Oconee County, SC | 11,430 | 2,261 | 90.20% | 1120 |
| Oconto County, WI | 5,613 | 663 | 63.58% | 2044 |
| Ogemaw County, MI | 2,837 | 724 | 82.21% | 505 |
| Oglala Lakota County, SD | 3,846 | 2,017 | 0.00% | 3846 |
| Ogle County, IL | 8,409 | 860 | 76.70% | 1959 |
| Oglethorpe County, GA | 2,321 | 471 | 74.60% | 590 |
| Ohio County, IN | 822 | 90 | 67.13% | 270 |
| Ohio County, KY | 4,276 | 987 | 57.16% | 1832 |
| Ohio County, WV | 5,655 | 944 | 95.21% | 271 |
| Okaloosa County, FL | 31,704 | 5,399 | 94.93% | 1607 |
| Okanogan County, WA | 6,900 | 1,716 | 42.81% | 3946 |
| Okeechobee County, FL | 5,963 | 1,958 | 85.55% | 862 |
| Okfuskee County, OK | 1,992 | 579 | 35.46% | 1286 |
| Oklahoma County, OK | 140,789 | 33,937 | 96.85% | 4438 |
| Okmulgee County, OK | 6,578 | 1,722 | 63.58% | 2396 |
| Oktibbeha County, MS | 6,109 | 1,719 | 88.13% | 725 |
| Oldham County, KY | 13,328 | 516 | 99.44% | 75 |
| Oldham County, TX | 196 | 45 | 53.90% | 90 |
| Oliver County, ND | 357 | 43 | 91.87% | 29 |
| Olmsted County, MN | 27,056 | 1,972 | 93.62% | 1725 |
| Oneida County, ID | 990 | 130 | 80.66% | 191 |
| Oneida County, NY | 34,926 | 6,834 | 95.76% | 1482 |
| Oneida County, WI | 4,334 | 546 | 68.51% | 1365 |
| Onondaga County, NY | 70,456 | 13,656 | 99.58% | 297 |
| Onslow County, NC | 30,324 | 6,454 | 99.01% | 301 |
| Ontario County, NY | 16,308 | 1,676 | 95.22% | 780 |
| Ontonagon County, MI | 567 | 124 | 67.60% | 184 |
| Orange County, CA | 502,035 | 65,187 | 99.07% | 4686 |
| Orange County, FL | 218,501 | 47,713 | 99.62% | 826 |
| Orange County, IN | 3,180 | 678 | 66.97% | 1050 |
| Orange County, NC | 21,690 | 1,996 | 95.69% | 935 |
| Orange County, NY | 70,866 | 11,595 | 99.95% | 36 |
| Orange County, TX | 14,713 | 2,763 | 88.90% | 1633 |
| Orange County, VA | 5,585 | 644 | 69.57% | 1699 |
| Orange County, VT | 3,802 | 474 | 70.36% | 1127 |
| Orangeburg County, SC | 13,969 | 4,768 | 61.99% | 5310 |
| Orleans County, NY | 5,593 | 878 | 96.76% | 181 |
| Orleans County, VT | 3,745 | 621 | 78.18% | 817 |
| Orleans Parish, LA | 54,434 | 18,509 | 98.14% | 1011 |
| Osage County, KS | 2,725 | 433 | 58.86% | 1121 |
| Osage County, MO | 2,301 | 217 | 15.59% | 1942 |
| Osage County, OK | 7,687 | 1,587 | 69.07% | 2378 |
| Osborne County, KS | 493 | 90 | 97.98% | 10 |
| Osceola County, FL | 65,757 | 13,069 | 99.02% | 643 |
| Osceola County, IA | 1,065 | 128 | 76.39% | 251 |
| Osceola County, MI | 3,677 | 842 | 29.83% | 2580 |
| Oscoda County, MI | 1,109 | 317 | 32.06% | 753 |
| Oswego County, NY | 17,790 | 3,755 | 93.45% | 1166 |
| Otero County, CO | 3,215 | 906 | 87.17% | 412 |
| Otero County, NM | 10,657 | 3,130 | 81.23% | 2001 |
| Otoe County, NE | 2,702 | 270 | 73.67% | 711 |
| Otsego County, MI | 3,785 | 565 | 85.36% | 554 |
| Otsego County, NY | 6,698 | 996 | 78.88% | 1414 |
| Ottawa County, KS | 996 | 120 | 59.45% | 404 |
| Ottawa County, MI | 50,788 | 2,711 | 98.15% | 938 |
| Ottawa County, OH | 5,683 | 641 | 92.52% | 425 |
| Ottawa County, OK | 5,507 | 1,576 | 89.22% | 593 |
| Otter Tail County, MN | 9,117 | 1,132 | 83.44% | 1509 |
| Ouachita County, AR | 3,872 | 1,098 | 51.64% | 1872 |
| Ouachita Parish, LA | 27,163 | 7,811 | 97.73% | 618 |
| Ouray County, CO | 591 | 57 | 36.74% | 374 |
| Outagamie County, WI | 31,742 | 2,375 | 95.69% | 1368 |
| Overton County, TN | 3,463 | 671 | 70.47% | 1023 |
| Owen County, IN | 3,175 | 587 | 82.86% | 544 |
| Owen County, KY | 1,805 | 356 | 64.18% | 647 |
| Owsley County, KY | 691 | 326 | 100.00% | - |
| Owyhee County, ID | 2,207 | 436 | 35.58% | 1422 |
| Oxford County, ME | 7,439 | 1,846 | 88.80% | 833 |
| Ozaukee County, WI | 14,232 | 509 | 97.91% | 298 |
| Pacific County, WA | 2,453 | 492 | 87.64% | 303 |
| Page County, IA | 1,895 | 338 | 87.74% | 232 |
| Page County, VA | 3,436 | 625 | 83.14% | 579 |
| Palm Beach County, FL | 204,816 | 35,036 | 98.97% | 2103 |
| Palo Alto County, IA | 1,444 | 191 | 60.78% | 566 |
| Palo Pinto County, TX | 4,823 | 1,127 | 69.52% | 1470 |
| Pamlico County, NC | 1,373 | 386 | 87.01% | 178 |
| Panola County, MS | 6,020 | 2,072 | 86.05% | 840 |
| Panola County, TX | 3,986 | 949 | 58.10% | 1670 |
| Park County, CO | 2,109 | 225 | 42.24% | 1218 |
| Park County, MT | 2,128 | 245 | 56.56% | 925 |
| Park County, WY | 4,391 | 550 | 71.05% | 1271 |
| Parke County, IN | 2,560 | 583 | 66.53% | 857 |
| Parker County, TX | 25,215 | 2,659 | 63.61% | 9175 |
| Parmer County, TX | 2,013 | 385 | 51.64% | 973 |
| Pasco County, FL | 79,761 | 12,170 | 98.94% | 846 |
| Pasquotank County, NC | 6,198 | 1,791 | 99.92% | 5 |
| Passaic County, NJ | 85,064 | 17,716 | 100.00% | - |
| Patrick County, VA | 2,302 | 481 | 45.53% | 1254 |
| Paulding County, GA | 31,954 | 3,394 | 99.85% | 49 |
| Paulding County, OH | 3,221 | 422 | 61.76% | 1232 |
| Pawnee County, KS | 662 | 110 | 69.73% | 200 |
| Pawnee County, NE | 389 | 82 | 56.73% | 168 |
| Pawnee County, OK | 2,851 | 522 | 0.00% | 2851 |
| Payette County, ID | 4,550 | 696 | 85.15% | 676 |
| Payne County, OK | 11,250 | 1,901 | 85.29% | 1655 |
| Peach County, GA | 4,087 | 1,265 | 92.53% | 305 |
| Pearl River County, MS | 9,177 | 2,283 | 95.64% | 400 |
| Pecos County, TX | 2,764 | 669 | 71.63% | 784 |
| Pembina County, ND | 1,040 | 104 | 100.00% | - |
| Pemiscot County, MO | 2,939 | 1,203 | 74.20% | 758 |
| Pend Oreille County, WA | 1,931 | 436 | 99.93% | 1 |
| Pender County, NC | 9,974 | 2,070 | 79.73% | 2022 |
| Pendleton County, KY | 2,343 | 509 | 72.63% | 641 |
| Pendleton County, WV | 924 | 184 | 26.46% | 680 |
| Pennington County, MN | 2,254 | 228 | 97.00% | 68 |
| Pennington County, SD | 17,911 | 3,189 | 95.55% | 797 |
| Penobscot County, ME | 19,392 | 3,222 | 93.45% | 1269 |
| Peoria County, IL | 29,568 | 6,384 | 95.61% | 1297 |
| Pepin County, WI | 1,087 | 160 | 84.24% | 171 |
| Perkins County, NE | 521 | 59 | 39.63% | 315 |
| Perkins County, SD | 430 | 68 | 98.66% | 6 |
| Perquimans County, NC | 1,810 | 479 | 93.52% | 117 |
| Perry County, AR | 1,639 | 385 | 67.46% | 533 |
| Perry County, IL | 2,968 | 593 | 74.13% | 768 |
| Perry County, IN | 2,887 | 418 | 81.15% | 544 |
| Perry County, KY | 4,056 | 1,495 | 96.41% | 146 |
| Perry County, MO | 3,229 | 429 | 50.35% | 1603 |
| Perry County, OH | 6,042 | 1,288 | 65.64% | 2076 |
| Perry County, PA | 6,870 | 841 | 85.55% | 993 |
| Perry County, TN | 1,259 | 319 | 38.03% | 780 |
| Pershing County, NV | 798 | 135 | 0.00% | 798 |
| Person County, NC | 5,991 | 1,355 | 87.22% | 766 |
| Petersburg Borough, AK | 471 | 42 | 81.42% | 88 |
| Petersburg city, VA | 4,220 | 1,708 | 98.75% | 53 |
| Petroleum County, MT | 73 | 20 | 42.31% | 42 |
| Pettis County, MO | 7,355 | 1,553 | 67.70% | 2376 |
| Phelps County, MO | 6,491 | 1,325 | 88.51% | 746 |
| Phelps County, NE | 1,579 | 168 | 83.30% | 264 |
| Philadelphia County, PA | 234,866 | 82,258 | 99.18% | 1922 |
| Phillips County, AR | 3,187 | 1,451 | 86.17% | 441 |
| Phillips County, CO | 763 | 120 | 92.12% | 60 |
| Phillips County, KS | 868 | 150 | 75.68% | 211 |
| Phillips County, MT | 655 | 141 | 84.06% | 104 |
| Piatt County, IL | 2,686 | 195 | 74.24% | 692 |
| Pickaway County, OH | 8,980 | 1,261 | 78.33% | 1946 |
| Pickens County, AL | 2,813 | 841 | 31.53% | 1926 |
| Pickens County, GA | 4,775 | 864 | 92.24% | 370 |
| Pickens County, SC | 16,964 | 2,675 | 97.17% | 480 |
| Pickett County, TN | 655 | 150 | 94.13% | 38 |
| Pierce County, GA | 3,507 | 854 | 77.42% | 792 |
| Pierce County, ND | 689 | 84 | 99.72% | 2 |
| Pierce County, NE | 1,286 | 135 | 73.20% | 345 |
| Pierce County, WA | 145,915 | 15,043 | 98.35% | 2402 |
| Pierce County, WI | 6,535 | 378 | 74.32% | 1678 |
| Pike County, AL | 4,441 | 1,312 | 55.07% | 1995 |
| Pike County, AR | 1,669 | 443 | 46.59% | 891 |
| Pike County, GA | 3,295 | 442 | 70.00% | 988 |
| Pike County, IL | 2,480 | 473 | 48.34% | 1281 |
| Pike County, IN | 1,940 | 240 | 59.97% | 777 |
| Pike County, KY | 8,728 | 2,554 | 69.80% | 2636 |
| Pike County, MO | 2,827 | 589 | 56.59% | 1227 |
| Pike County, MS | 7,501 | 3,583 | 76.13% | 1791 |
| Pike County, OH | 4,739 | 1,351 | 74.91% | 1189 |
| Pike County, PA | 7,749 | 1,084 | 98.94% | 82 |
| Pima County, AZ | 154,758 | 33,173 | 93.36% | 10281 |
| Pinal County, AZ | 73,825 | 12,331 | 73.20% | 19785 |
| Pine County, MN | 4,177 | 575 | 52.00% | 2005 |
| Pinellas County, FL | 112,711 | 16,177 | 99.95% | 58 |
| Pipestone County, MN | 1,645 | 239 | 82.93% | 281 |
| Piscataquis County, ME | 1,956 | 441 | 72.64% | 535 |
| Pitkin County, CO | 1,977 | 114 | 89.88% | 200 |
| Pitt County, NC | 27,419 | 7,026 | 96.31% | 1012 |
| Pittsburg County, OK | 6,984 | 1,843 | 65.16% | 2433 |
| Pittsylvania County, VA | 8,752 | 1,848 | 63.08% | 3231 |
| Piute County, UT | 248 | 66 | 100.00% | - |
| Placer County, CA | 65,660 | 4,482 | 94.27% | 3760 |
| Plaquemines Parish, LA | 4,405 | 805 | 85.02% | 660 |
| Platte County, MO | 17,782 | 1,182 | 92.98% | 1248 |
| Platte County, NE | 6,092 | 590 | 79.43% | 1253 |
| Platte County, WY | 1,253 | 194 | 49.22% | 636 |
| Pleasants County, WV | 999 | 154 | 60.12% | 398 |
| Plumas County, CA | 2,253 | 427 | 21.69% | 1764 |
| Plymouth County, IA | 4,551 | 407 | 67.55% | 1477 |
| Plymouth County, MA | 81,712 | 5,668 | 98.26% | 1422 |
| Pocahontas County, IA | 1,112 | 184 | 70.15% | 332 |
| Pocahontas County, WV | 1,017 | 261 | 43.46% | 575 |
| Poinsett County, AR | 4,039 | 1,340 | 62.74% | 1505 |
| Pointe Coupee Parish, LA | 3,429 | 916 | 67.64% | 1110 |
| Polk County, AR | 3,302 | 920 | 66.40% | 1110 |
| Polk County, FL | 112,953 | 25,934 | 96.55% | 3894 |
| Polk County, GA | 7,687 | 2,075 | 97.76% | 172 |
| Polk County, IA | 84,659 | 9,321 | 98.57% | 1212 |
| Polk County, MN | 5,292 | 846 | 93.00% | 370 |
| Polk County, MO | 5,099 | 1,155 | 58.62% | 2110 |
| Polk County, NC | 2,489 | 464 | 73.98% | 648 |
| Polk County, NE | 922 | 93 | 54.74% | 417 |
| Polk County, OR | 14,160 | 1,749 | 90.99% | 1276 |
| Polk County, TN | 2,402 | 548 | 81.37% | 448 |
| Polk County, TX | 7,252 | 1,726 | 45.57% | 3948 |
| Polk County, WI | 6,664 | 817 | 64.75% | 2349 |
| Pondera County, MT | 890 | 229 | 12.32% | 780 |
| Pontotoc County, MS | 6,054 | 1,562 | 57.18% | 2592 |
| Pontotoc County, OK | 6,517 | 1,221 | 74.06% | 1691 |
| Pope County, AR | 10,219 | 1,946 | 87.74% | 1253 |
| Pope County, IL | 359 | 96 | 78.32% | 78 |
| Pope County, MN | 1,653 | 142 | 67.55% | 536 |
| Poquoson city, VA | 2,081 | 97 | 99.14% | 18 |
| Portage County, OH | 22,517 | 2,827 | 96.88% | 702 |
| Portage County, WI | 9,893 | 859 | 88.07% | 1180 |
| Porter County, IN | 27,470 | 3,072 | 97.60% | 660 |
| Portsmouth city, VA | 14,569 | 3,867 | 98.20% | 263 |
| Posey County, IN | 4,142 | 428 | 78.78% | 879 |
| Pottawatomie County, KS | 5,058 | 435 | 96.14% | 195 |
| Pottawatomie County, OK | 12,395 | 2,714 | 86.21% | 1709 |
| Pottawattamie County, IA | 15,633 | 2,035 | 89.28% | 1676 |
| Potter County, PA | 2,442 | 547 | 71.05% | 707 |
| Potter County, SD | 353 | 50 | 100.00% | - |
| Potter County, TX | 23,178 | 6,333 | 91.35% | 2005 |
| Powder River County, MT | 204 | 32 | 38.04% | 126 |
| Powell County, MT | 726 | 146 | 54.76% | 328 |
| Power County, ID | 1,746 | 325 | 79.79% | 353 |
| Poweshiek County, IA | 2,665 | 303 | 74.03% | 692 |
| Powhatan County, VA | 3,948 | 267 | 82.23% | 702 |
| Prairie County, AR | 1,161 | 274 | 33.51% | 772 |
| Prairie County, MT | 137 | 31 | 61.49% | 53 |
| Pratt County, KS | 1,626 | 236 | 80.52% | 317 |
| Preble County, OH | 6,759 | 886 | 86.79% | 893 |
| Prentiss County, MS | 4,008 | 1,013 | 67.11% | 1318 |
| Presque Isle County, MI | 1,481 | 321 | 36.25% | 944 |
| Preston County, WV | 4,559 | 985 | 58.76% | 1880 |
| Price County, WI | 1,781 | 309 | 39.35% | 1080 |
| Prince Edward County, VA | 2,573 | 705 | 69.06% | 796 |
| Prince George County, VA | 5,997 | 589 | 86.31% | 821 |
| Prince George's County, MD | 139,459 | 15,002 | 97.79% | 3087 |
| Prince of Wales-Hyder Census Area, AK | 1,054 | 223 | 0.00% | 1054 |
| Prince William County, VA | 90,402 | 7,257 | 99.05% | 859 |
| Providence County, RI | 91,968 | 19,863 | 98.82% | 1084 |
| Prowers County, CO | 2,243 | 607 | 73.80% | 588 |
| Pueblo County, CO | 27,340 | 5,534 | 93.05% | 1901 |
| Pulaski County, AR | 63,497 | 15,176 | 98.21% | 1137 |
| Pulaski County, GA | 1,565 | 528 | 72.86% | 425 |
| Pulaski County, IN | 2,056 | 314 | 53.47% | 957 |
| Pulaski County, KY | 10,262 | 2,536 | 97.33% | 274 |
| Pulaski County, MO | 7,668 | 1,275 | 94.72% | 405 |
| Pulaski County, VA | 4,281 | 804 | 86.96% | 558 |
| Pushmataha County, OK | 1,759 | 512 | 5.19% | 1668 |
| Putnam County, FL | 11,219 | 3,548 | 85.59% | 1617 |
| Putnam County, GA | 3,177 | 886 | 94.99% | 159 |
| Putnam County, IL | 850 | 98 | 63.07% | 314 |
| Putnam County, IN | 5,248 | 700 | 73.76% | 1377 |
| Putnam County, MO | 743 | 163 | 72.34% | 205 |
| Putnam County, NY | 14,916 | 893 | 99.45% | 82 |
| Putnam County, OH | 6,211 | 379 | 88.10% | 739 |
| Putnam County, TN | 11,637 | 2,018 | 94.18% | 677 |
| Putnam County, WV | 9,391 | 1,146 | 85.52% | 1360 |
| Queen Anne's County, MD | 8,150 | 638 | 91.42% | 699 |
| Queens County, NY | 311,560 | 45,647 | 99.99% | 17 |
| Quitman County, GA | 284 | 113 | 65.46% | 98 |
| Quitman County, MS | 1,181 | 602 | 63.20% | 435 |
| Rabun County, GA | 1,962 | 478 | 89.51% | 206 |
| Racine County, WI | 32,583 | 5,318 | 98.95% | 343 |
| Radford city, VA | 1,596 | 261 | 99.67% | 5 |
| Rains County, TX | 1,821 | 400 | 8.66% | 1663 |
| Raleigh County, WV | 11,103 | 2,539 | 94.10% | 655 |
| Ralls County, MO | 1,627 | 191 | 84.26% | 256 |
| Ramsey County, MN | 88,409 | 18,187 | 99.44% | 492 |
| Ramsey County, ND | 1,857 | 269 | 99.97% | - |
| Randall County, TX | 23,264 | 2,538 | 97.21% | 649 |
| Randolph County, AL | 3,501 | 1,004 | 49.36% | 1773 |
| Randolph County, AR | 2,944 | 736 | 63.73% | 1068 |
| Randolph County, GA | 989 | 452 | 82.69% | 171 |
| Randolph County, IL | 4,443 | 729 | 73.45% | 1179 |
| Randolph County, IN | 4,054 | 787 | 65.43% | 1402 |
| Randolph County, MO | 3,814 | 917 | 73.16% | 1024 |
| Randolph County, NC | 23,644 | 4,511 | 97.96% | 483 |
| Randolph County, WV | 3,754 | 874 | 55.85% | 1657 |
| Rankin County, MS | 26,178 | 2,924 | 94.52% | 1435 |
| Ransom County, ND | 837 | 66 | 99.32% | 6 |
| Rapides Parish, LA | 22,922 | 5,218 | 87.29% | 2913 |
| Rappahannock County, VA | 908 | 112 | 91.86% | 74 |
| Ravalli County, MT | 6,001 | 1,163 | 47.60% | 3145 |
| Rawlins County, KS | 362 | 71 | 50.50% | 179 |
| Ray County, MO | 3,809 | 479 | 64.25% | 1362 |
| Reagan County, TX | 796 | 106 | 1.31% | 786 |
| Real County, TX | 403 | 152 | 68.18% | 128 |
| Red Lake County, MN | 719 | 73 | 100.00% | - |
| Red River County, TX | 1,765 | 495 | 78.04% | 388 |
| Red River Parish, LA | 1,424 | 449 | 67.69% | 460 |
| Red Willow County, NE | 1,681 | 223 | 84.60% | 259 |
| Redwood County, MN | 2,715 | 358 | 69.80% | 820 |
| Reeves County, TX | 2,493 | 541 | 67.67% | 806 |
| Refugio County, TX | 1,130 | 287 | 70.91% | 329 |
| Reno County, KS | 10,201 | 1,340 | 81.80% | 1857 |
| Rensselaer County, NY | 22,325 | 3,292 | 99.67% | 74 |
| Renville County, MN | 2,397 | 357 | 55.52% | 1066 |
| Renville County, ND | 392 | 27 | 91.05% | 35 |
| Republic County, KS | 701 | 103 | 66.57% | 234 |
| Rhea County, TN | 5,390 | 1,364 | 90.09% | 534 |
| Rice County, KS | 1,555 | 277 | 80.75% | 299 |
| Rice County, MN | 10,414 | 1,110 | 94.63% | 560 |
| Rich County, UT | 527 | 56 | 63.52% | 192 |
| Richardson County, NE | 1,185 | 191 | 92.51% | 89 |
| Richland County, IL | 2,554 | 511 | 73.60% | 674 |
| Richland County, MT | 1,973 | 185 | 86.17% | 273 |
| Richland County, ND | 2,515 | 245 | 88.64% | 286 |
| Richland County, OH | 18,747 | 3,421 | 92.36% | 1432 |
| Richland County, SC | 63,326 | 12,037 | 98.70% | 825 |
| Richland County, WI | 2,742 | 533 | 53.61% | 1272 |
| Richmond city, VA | 25,968 | 8,981 | 95.46% | 1179 |
| Richmond County, GA | 31,505 | 9,927 | 95.20% | 1514 |
| Richmond County, NC | 7,336 | 2,134 | 94.10% | 433 |
| Richmond County, NY | 75,785 | 10,619 | 100.00% | - |
| Richmond County, VA | 1,115 | 232 | 56.95% | 480 |
| Riley County, KS | 7,943 | 1,016 | 89.55% | 830 |
| Ringgold County, IA | 844 | 182 | 59.46% | 342 |
| Rio Arriba County, NM | 6,570 | 1,751 | 60.23% | 2613 |
| Rio Blanco County, CO | 1,118 | 131 | 71.86% | 315 |
| Rio Grande County, CO | 1,853 | 430 | 66.67% | 618 |
| Ripley County, IN | 4,951 | 727 | 57.82% | 2088 |
| Ritchie County, WV | 1,391 | 347 | 16.91% | 1156 |
| Riverside County, CA | 449,028 | 73,063 | 96.86% | 14084 |
| Roane County, TN | 7,444 | 1,575 | 96.06% | 293 |
| Roane County, WV | 2,158 | 630 | 39.83% | 1298 |
| Roanoke city, VA | 15,046 | 4,551 | 98.74% | 189 |
| Roanoke County, VA | 14,233 | 1,041 | 97.48% | 359 |
| Roberts County, SD | 1,995 | 609 | 79.47% | 410 |
| Roberts County, TX | 157 | 16 | 64.05% | 56 |
| Robertson County, KY | 328 | 86 | 46.10% | 177 |
| Robertson County, TN | 12,292 | 1,687 | 92.31% | 945 |
| Robertson County, TX | 2,991 | 745 | 38.83% | 1829 |
| Robeson County, NC | 23,379 | 8,122 | 86.15% | 3238 |
| Rock County, MN | 1,780 | 193 | 99.74% | 5 |
| Rock County, NE | 183 | 42 | 83.16% | 31 |
| Rock County, WI | 26,919 | 3,743 | 92.50% | 2020 |
| Rock Island County, IL | 22,532 | 4,726 | 97.45% | 574 |
| Rockbridge County, VA | 2,976 | 433 | 82.05% | 534 |
| Rockcastle County, KY | 2,627 | 731 | 94.25% | 151 |
| Rockdale County, GA | 16,740 | 3,541 | 99.34% | 111 |
| Rockingham County, NC | 13,341 | 3,229 | 98.64% | 181 |
| Rockingham County, NH | 44,762 | 2,504 | 99.29% | 316 |
| Rockingham County, VA | 13,047 | 1,131 | 83.29% | 2180 |
| Rockland County, NY | 64,530 | 14,288 | 100.00% | 2 |
| Rockwall County, TX | 20,641 | 1,316 | 97.32% | 554 |
| Roger Mills County, OK | 663 | 116 | 15.46% | 560 |
| Rogers County, OK | 15,834 | 1,712 | 81.56% | 2920 |
| Rolette County, ND | 3,547 | 811 | 92.72% | 258 |
| Rooks County, KS | 784 | 120 | 86.89% | 103 |
| Roosevelt County, MT | 2,497 | 656 | 73.93% | 651 |
| Roosevelt County, NM | 3,090 | 895 | 81.76% | 563 |
| Roscommon County, MI | 2,555 | 810 | 94.58% | 138 |
| Roseau County, MN | 2,674 | 270 | 63.85% | 967 |
| Rosebud County, MT | 1,818 | 377 | 45.74% | 986 |
| Ross County, OH | 11,560 | 2,630 | 92.05% | 919 |
| Routt County, CO | 3,444 | 243 | 77.51% | 775 |
| Rowan County, KY | 3,275 | 748 | 98.68% | 43 |
| Rowan County, NC | 22,551 | 5,403 | 98.98% | 231 |
| Runnels County, TX | 1,752 | 380 | 71.01% | 508 |
| Rush County, IN | 2,725 | 408 | 55.78% | 1205 |
| Rush County, KS | 470 | 90 | 81.98% | 85 |
| Rusk County, TX | 8,934 | 1,727 | 60.24% | 3552 |
| Rusk County, WI | 2,056 | 435 | 52.67% | 973 |
| Russell County, AL | 9,768 | 3,189 | 91.22% | 858 |
| Russell County, KS | 1,048 | 190 | 98.68% | 14 |
| Russell County, KY | 2,830 | 811 | 88.09% | 337 |
| Russell County, VA | 3,708 | 740 | 88.70% | 419 |
| Rutherford County, NC | 10,032 | 2,595 | 83.03% | 1703 |
| Rutherford County, TN | 57,751 | 6,515 | 97.48% | 1453 |
| Rutland County, VT | 7,423 | 929 | 98.65% | 100 |
| Sabine County, TX | 1,445 | 392 | 65.52% | 498 |
| Sabine Parish, LA | 4,155 | 1,131 | 27.76% | 3001 |
| Sac County, IA | 1,558 | 208 | 52.60% | 739 |
| Sacramento County, CA | 260,719 | 53,652 | 97.85% | 5608 |
| Sagadahoc County, ME | 4,890 | 576 | 98.50% | 73 |
| Saginaw County, MI | 28,984 | 6,244 | 95.61% | 1272 |
| Salem city, VA | 3,637 | 424 | 96.67% | 121 |
| Salem County, NJ | 9,783 | 1,523 | 96.88% | 306 |
| Saline County, AR | 20,658 | 2,464 | 94.43% | 1150 |
| Saline County, IL | 3,380 | 1,038 | 77.16% | 772 |
| Saline County, KS | 8,851 | 1,295 | 89.15% | 961 |
| Saline County, MO | 3,629 | 670 | 78.32% | 787 |
| Saline County, NE | 2,566 | 302 | 80.12% | 510 |
| Salt Lake County, UT | 222,189 | 21,470 | 99.23% | 1717 |
| Saluda County, SC | 3,171 | 758 | 53.58% | 1472 |
| Sampson County, NC | 11,096 | 3,671 | 63.01% | 4105 |
| San Benito County, CA | 11,600 | 1,311 | 91.49% | 987 |
| San Bernardino County, CA | 409,379 | 83,763 | 96.53% | 14212 |
| San Diego County, CA | 505,818 | 76,580 | 96.56% | 17376 |
| San Francisco County, CA | 76,630 | 8,525 | 99.82% | 137 |
| San Jacinto County, TX | 4,514 | 1,182 | 42.52% | 2595 |
| San Joaquin County, CA | 148,410 | 30,463 | 95.03% | 7379 |
| San Juan County, CO | 63 | 14 | 63.52% | 23 |
| San Juan County, NM | 23,929 | 5,476 | 71.01% | 6936 |
| San Juan County, UT | 3,507 | 859 | 25.46% | 2614 |
| San Juan County, WA | 1,696 | 195 | 89.05% | 186 |
| San Luis Obispo County, CA | 36,059 | 3,651 | 86.24% | 4962 |
| San Mateo County, CA | 113,004 | 7,247 | 99.53% | 536 |
| San Miguel County, CO | 1,096 | 101 | 65.33% | 380 |
| San Miguel County, NM | 3,569 | 1,193 | 58.46% | 1482 |
| San Patricio County, TX | 12,773 | 3,266 | 90.50% | 1213 |
| San Saba County, TX | 849 | 228 | 71.95% | 238 |
| Sanborn County, SD | 373 | 68 | 100.00% | - |
| Sanders County, MT | 1,393 | 337 | 22.56% | 1079 |
| Sandoval County, NM | 25,155 | 3,184 | 86.56% | 3381 |
| Sandusky County, OH | 9,488 | 1,165 | 93.00% | 664 |
| Sangamon County, IL | 31,461 | 5,579 | 94.83% | 1626 |
| Sanilac County, MI | 6,431 | 1,302 | 45.21% | 3523 |
| Sanpete County, UT | 5,569 | 856 | 90.13% | 549 |
| Santa Barbara County, CA | 69,209 | 10,169 | 93.46% | 4526 |
| Santa Clara County, CA | 305,188 | 21,099 | 97.59% | 7361 |
| Santa Cruz County, AZ | 9,131 | 3,153 | 84.14% | 1449 |
| Santa Cruz County, CA | 38,004 | 5,221 | 95.09% | 1868 |
| Santa Fe County, NM | 20,084 | 3,129 | 88.51% | 2307 |
| Santa Rosa County, FL | 28,685 | 3,314 | 96.90% | 891 |
| Sarasota County, FL | 44,649 | 6,997 | 97.71% | 1025 |
| Saratoga County, NY | 33,718 | 2,049 | 99.74% | 88 |
| Sargent County, ND | 576 | 58 | 100.00% | - |
| Sarpy County, NE | 36,437 | 2,019 | 96.78% | 1172 |
| Sauk County, WI | 10,422 | 1,107 | 83.89% | 1679 |
| Saunders County, NE | 3,757 | 268 | 75.36% | 926 |
| Sawyer County, WI | 2,300 | 526 | 76.36% | 544 |
| Schenectady County, NY | 23,807 | 3,695 | 99.78% | 52 |
| Schleicher County, TX | 585 | 124 | 0.00% | 585 |
| Schley County, GA | 1,031 | 223 | 78.02% | 227 |
| Schoharie County, NY | 4,023 | 549 | 89.54% | 421 |
| Schoolcraft County, MI | 1,012 | 201 | 57.57% | 429 |
| Schuyler County, IL | 945 | 127 | 54.06% | 434 |
| Schuyler County, MO | 764 | 215 | 1.85% | 750 |
| Schuyler County, NY | 2,446 | 476 | 79.61% | 499 |
| Schuylkill County, PA | 20,492 | 2,869 | 92.05% | 1629 |
| Scioto County, OH | 11,677 | 3,243 | 84.73% | 1783 |
| Scotland County, MO | 1,002 | 232 | 89.92% | 101 |
| Scotland County, NC | 5,515 | 2,120 | 90.35% | 532 |
| Scott County, AR | 1,749 | 475 | 52.71% | 827 |
| Scott County, IA | 29,219 | 4,755 | 97.76% | 653 |
| Scott County, IL | 796 | 110 | 49.86% | 399 |
| Scott County, IN | 3,846 | 756 | 78.55% | 825 |
| Scott County, KS | 983 | 120 | 80.77% | 189 |
| Scott County, KY | 10,186 | 1,034 | 90.45% | 973 |
| Scott County, MN | 29,893 | 1,696 | 95.07% | 1474 |
| Scott County, MO | 6,599 | 1,573 | 84.27% | 1038 |
| Scott County, MS | 5,281 | 1,964 | 68.78% | 1649 |
| Scott County, TN | 3,867 | 919 | 99.91% | 3 |
| Scott County, VA | 2,894 | 624 | 82.02% | 520 |
| Scotts Bluff County, NE | 6,347 | 1,107 | 86.99% | 825 |
| Screven County, GA | 1,953 | 897 | 98.59% | 28 |
| Scurry County, TX | 3,034 | 594 | 77.74% | 675 |
| Searcy County, AR | 1,175 | 392 | 50.05% | 587 |
| Sebastian County, AR | 21,588 | 4,487 | 95.25% | 1024 |
| Sedgwick County, CO | 347 | 88 | 74.53% | 88 |
| Sedgwick County, KS | 94,256 | 14,599 | 96.30% | 3485 |
| Seminole County, FL | 72,434 | 8,872 | 99.91% | 65 |
| Seminole County, GA | 1,249 | 482 | 77.70% | 279 |
| Seminole County, OK | 4,389 | 1,131 | 56.74% | 1899 |
| Seneca County, NY | 4,785 | 889 | 80.93% | 912 |
| Seneca County, OH | 8,791 | 1,184 | 87.44% | 1104 |
| Sequatchie County, TN | 2,296 | 547 | 59.52% | 929 |
| Sequoyah County, OK | 6,704 | 1,845 | 53.77% | 3099 |
| Sevier County, AR | 3,462 | 1,015 | 76.69% | 807 |
| Sevier County, TN | 14,326 | 3,001 | 94.85% | 738 |
| Sevier County, UT | 4,647 | 637 | 93.69% | 293 |
| Seward County, KS | 4,820 | 832 | 57.54% | 2046 |
| Seward County, NE | 3,026 | 191 | 75.00% | 757 |
| Shackelford County, TX | 557 | 105 | 40.14% | 333 |
| Shasta County, CA | 27,105 | 4,487 | 78.13% | 5927 |
| Shawano County, WI | 6,298 | 842 | 56.71% | 2726 |
| Shawnee County, KS | 29,955 | 4,563 | 95.35% | 1393 |
| Sheboygan County, WI | 18,657 | 1,778 | 91.17% | 1647 |
| Shelby County, AL | 37,632 | 3,069 | 98.85% | 433 |
| Shelby County, IA | 1,963 | 169 | 92.62% | 145 |
| Shelby County, IL | 3,309 | 426 | 48.07% | 1718 |
| Shelby County, IN | 7,359 | 1,081 | 80.61% | 1427 |
| Shelby County, KY | 7,890 | 977 | 91.33% | 684 |
| Shelby County, MO | 1,003 | 198 | 45.85% | 543 |
| Shelby County, OH | 8,653 | 934 | 88.40% | 1004 |
| Shelby County, TN | 164,699 | 48,647 | 99.07% | 1538 |
| Shenandoah County, VA | 6,564 | 918 | 84.90% | 991 |
| Sherburne County, MN | 18,443 | 1,029 | 90.68% | 1720 |
| Sheridan County, KS | 460 | 100 | 76.37% | 109 |
| Sheridan County, MT | 509 | 60 | 86.35% | 69 |
| Sheridan County, ND | 180 | 39 | 100.00% | - |
| Sheridan County, NE | 793 | 190 | 63.98% | 286 |
| Sheridan County, WY | 4,620 | 447 | 82.85% | 792 |
| Sherman County, KS | 976 | 189 | 86.64% | 130 |
| Sherman County, NE | 460 | 88 | 43.97% | 258 |
| Sherman County, OR | 208 | 35 | 63.00% | 77 |
| Sherman County, TX | 655 | 95 | 40.05% | 393 |
| Shiawassee County, MI | 10,403 | 1,404 | 82.49% | 1822 |
| Shoshone County, ID | 1,821 | 434 | 0.00% | 1821 |
| Sibley County, MN | 2,624 | 251 | 65.14% | 915 |
| Sierra County, CA | 331 | 59 | 12.99% | 288 |
| Sierra County, NM | 1,129 | 497 | 78.36% | 244 |
| Silver Bow County, MT | 4,920 | 909 | 89.71% | 506 |
| Simpson County, KY | 3,188 | 640 | 68.22% | 1013 |
| Simpson County, MS | 4,608 | 1,277 | 80.97% | 877 |
| Sioux County, IA | 6,866 | 458 | 82.10% | 1229 |
| Sioux County, ND | 1,091 | 352 | 98.46% | 17 |
| Sioux County, NE | 175 | 41 | 15.26% | 148 |
| Siskiyou County, CA | 6,393 | 1,510 | 34.67% | 4176 |
| Sitka Borough, AK | 1,361 | 99 | 97.96% | 28 |
| Skagit County, WA | 19,540 | 2,099 | 92.79% | 1408 |
| Skagway Municipality, AK | 120 | 11 | 97.73% | 3 |
| Skamania County, WA | 1,660 | 247 | 49.03% | 846 |
| Slope County, ND | 113 | 18 | 99.04% | 1 |
| Smith County, KS | 503 | 91 | 89.26% | 54 |
| Smith County, MS | 2,762 | 638 | 40.05% | 1656 |
| Smith County, TN | 3,236 | 570 | 86.05% | 451 |
| Smith County, TX | 40,051 | 8,563 | 90.93% | 3633 |
| Smyth County, VA | 4,350 | 988 | 94.43% | 242 |
| Snohomish County, WA | 129,832 | 10,351 | 97.04% | 3846 |
| Snyder County, PA | 6,146 | 848 | 64.39% | 2189 |
| Solano County, CA | 70,742 | 6,647 | 96.58% | 2419 |
| Somerset County, MD | 3,022 | 942 | 60.87% | 1183 |
| Somerset County, ME | 6,825 | 1,290 | 90.28% | 664 |
| Somerset County, NJ | 54,671 | 2,638 | 99.74% | 144 |
| Somerset County, PA | 9,634 | 1,669 | 83.53% | 1587 |
| Somervell County, TX | 1,502 | 203 | 64.63% | 531 |
| Sonoma County, CA | 71,666 | 7,542 | 97.66% | 1677 |
| Southampton County, VA | 2,480 | 442 | 48.00% | 1290 |
| Southeast Fairbanks Census Area, AK | 1,226 | 211 | 2.28% | 1198 |
| Spalding County, GA | 11,122 | 3,102 | 97.20% | 311 |
| Spartanburg County, SC | 52,586 | 10,912 | 96.26% | 1966 |
| Spencer County, IN | 3,300 | 359 | 58.78% | 1360 |
| Spencer County, KY | 3,163 | 277 | 87.89% | 383 |
| Spink County, SD | 958 | 149 | 70.38% | 284 |
| Spokane County, WA | 80,774 | 10,844 | 94.19% | 4690 |
| Spotsylvania County, VA | 24,455 | 2,344 | 95.92% | 998 |
| St. Bernard Parish, LA | 8,975 | 2,570 | 99.62% | 34 |
| St. Charles County, MO | 67,979 | 4,270 | 98.92% | 734 |
| St. Charles Parish, LA | 9,470 | 1,542 | 98.39% | 152 |
| St. Clair County, AL | 14,571 | 2,041 | 80.19% | 2887 |
| St. Clair County, IL | 43,924 | 8,715 | 96.39% | 1584 |
| St. Clair County, MI | 24,437 | 4,226 | 81.47% | 4528 |
| St. Clair County, MO | 1,276 | 379 | 37.84% | 793 |
| St. Croix County, WI | 16,377 | 737 | 69.66% | 4970 |
| St. Francois County, MO | 10,044 | 2,343 | 87.74% | 1231 |
| St. James Parish, LA | 3,485 | 854 | 99.78% | 8 |
| St. John the Baptist Parish, LA | 7,811 | 1,940 | 99.97% | 3 |
| St. Johns County, FL | 41,954 | 2,774 | 97.48% | 1057 |
| St. Joseph County, IN | 45,177 | 7,198 | 96.04% | 1790 |
| St. Joseph County, MI | 10,581 | 1,761 | 83.55% | 1740 |
| St. Landry Parish, LA | 15,748 | 6,892 | 85.01% | 2360 |
| St. Lawrence County, NY | 15,806 | 2,872 | 90.99% | 1424 |
| St. Louis city, MO | 37,743 | 14,241 | 99.97% | 11 |
| St. Louis County, MN | 26,724 | 3,500 | 86.00% | 3742 |
| St. Louis County, MO | 157,791 | 23,483 | 99.84% | 245 |
| St. Lucie County, FL | 46,255 | 8,399 | 97.93% | 956 |
| St. Martin Parish, LA | 9,248 | 2,456 | 95.41% | 425 |
| St. Mary Parish, LA | 8,364 | 2,193 | 93.60% | 535 |
| St. Mary's County, MD | 19,768 | 1,986 | 96.93% | 606 |
| St. Tammany Parish, LA | 45,513 | 7,029 | 99.33% | 305 |
| Stafford County, KS | 698 | 136 | 29.82% | 490 |
| Stafford County, VA | 29,056 | 1,617 | 99.37% | 183 |
| Stanislaus County, CA | 107,314 | 21,741 | 96.27% | 4006 |
| Stanley County, SD | 532 | 53 | 91.98% | 43 |
| Stanly County, NC | 9,555 | 1,774 | 98.12% | 180 |
| Stanton County, KS | 374 | 61 | 100.00% | - |
| Stanton County, NE | 1,095 | 110 | 76.03% | 262 |
| Stark County, IL | 848 | 139 | 63.51% | 309 |
| Stark County, ND | 5,620 | 389 | 99.20% | 45 |
| Stark County, OH | 57,193 | 12,463 | 99.33% | 384 |
| Starke County, IN | 3,784 | 752 | 70.84% | 1103 |
| Starr County, TX | 14,863 | 6,832 | 93.70% | 936 |
| Staunton city, VA | 3,038 | 593 | 98.11% | 57 |
| Ste. Genevieve County, MO | 2,831 | 361 | 42.38% | 1631 |
| Stearns County, MN | 25,840 | 3,351 | 88.89% | 2871 |
| Steele County, MN | 6,723 | 731 | 85.19% | 996 |
| Steele County, ND | 277 | 30 | 66.94% | 92 |
| Stephens County, GA | 4,096 | 986 | 92.67% | 300 |
| Stephens County, OK | 7,302 | 1,561 | 73.77% | 1915 |
| Stephens County, TX | 1,508 | 456 | 81.32% | 282 |
| Stephenson County, IL | 6,962 | 1,260 | 82.01% | 1252 |
| Sterling County, TX | 263 | 46 | 0.00% | 263 |
| Steuben County, IN | 4,973 | 729 | 74.31% | 1277 |
| Steuben County, NY | 14,784 | 2,536 | 82.67% | 2562 |
| Stevens County, KS | 1,252 | 170 | 98.86% | 14 |
| Stevens County, MN | 1,479 | 111 | 98.19% | 27 |
| Stevens County, WA | 7,171 | 1,330 | 98.71% | 93 |
| Stewart County, GA | 539 | 210 | 65.58% | 186 |
| Stewart County, TN | 2,046 | 434 | 78.03% | 449 |
| Stillwater County, MT | 1,616 | 154 | 62.88% | 600 |
| Stoddard County, MO | 4,525 | 919 | 60.78% | 1774 |
| Stokes County, NC | 6,347 | 1,054 | 96.68% | 211 |
| Stone County, MO | 3,854 | 798 | 57.26% | 1647 |
| Stone County, MS | 2,838 | 713 | 80.74% | 547 |
| Stonewall County, TX | 221 | 37 | 82.15% | 39 |
| Storey County, NV | 383 | 40 | 47.86% | 200 |
| Story County, IA | 11,467 | 762 | 93.94% | 695 |
| Strafford County, NH | 17,387 | 1,658 | 98.84% | 202 |
| Stutsman County, ND | 2,999 | 293 | 98.37% | 49 |
| Sublette County, WY | 1,633 | 106 | 13.49% | 1413 |
| Suffolk city, VA | 15,631 | 2,473 | 95.33% | 731 |
| Suffolk County, MA | 90,432 | 22,054 | 97.24% | 2497 |
| Suffolk County, NY | 228,319 | 19,507 | 99.99% | 23 |
| Sullivan County, IN | 2,809 | 491 | 56.48% | 1222 |
| Sullivan County, MO | 968 | 196 | 60.31% | 384 |
| Sullivan County, NH | 5,885 | 763 | 85.07% | 878 |
| Sullivan County, NY | 11,250 | 2,625 | 99.08% | 103 |
| Sullivan County, PA | 429 | 87 | 41.63% | 250 |
| Sullivan County, TN | 22,314 | 5,180 | 100.00% | - |
| Sully County, SD | 214 | 22 | 100.00% | - |
| Summit County, CO | 3,561 | 225 | 94.80% | 185 |
| Summit County, OH | 81,246 | 13,511 | 99.98% | 14 |
| Summit County, UT | 7,898 | 422 | 92.73% | 574 |
| Sumner County, KS | 4,237 | 620 | 99.91% | 4 |
| Sumner County, TN | 32,043 | 3,353 | 99.49% | 163 |
| Sumter County, FL | 6,417 | 1,678 | 95.16% | 311 |
| Sumter County, GA | 4,844 | 1,901 | 77.08% | 1110 |
| Sumter County, SC | 18,027 | 5,076 | 96.58% | 616 |
| Sunflower County, MS | 4,219 | 1,754 | 73.15% | 1133 |
| Surry County, NC | 11,175 | 2,528 | 98.53% | 165 |
| Surry County, VA | 810 | 156 | 0.01% | 810 |
| Susquehanna County, PA | 5,500 | 981 | 22.37% | 4270 |
| Sussex County, DE | 30,431 | 6,546 | 95.12% | 1486 |
| Sussex County, NJ | 21,251 | 1,165 | 99.97% | 6 |
| Sussex County, VA | 1,236 | 355 | 33.45% | 823 |
| Sutter County, CA | 18,120 | 3,270 | 94.69% | 962 |
| Sutton County, TX | 647 | 146 | 81.83% | 118 |
| Suwannee County, FL | 6,781 | 1,864 | 83.36% | 1129 |
| Swain County, NC | 2,093 | 476 | 47.23% | 1105 |
| Sweet Grass County, MT | 550 | 62 | 86.66% | 73 |
| Sweetwater County, WY | 8,155 | 697 | 95.12% | 398 |
| Swift County, MN | 1,546 | 192 | 90.39% | 149 |
| Swisher County, TX | 1,400 | 374 | 77.92% | 309 |
| Switzerland County, IN | 1,909 | 540 | 38.30% | 1178 |
| Talbot County, GA | 747 | 291 | 86.15% | 103 |
| Talbot County, MD | 4,924 | 673 | 87.98% | 592 |
| Taliaferro County, GA | 202 | 82 | 91.38% | 17 |
| Talladega County, AL | 12,094 | 2,918 | 78.65% | 2582 |
| Tallahatchie County, MS | 1,942 | 765 | 62.95% | 719 |
| Tallapoosa County, AL | 6,024 | 2,024 | 91.83% | 492 |
| Tama County, IA | 2,920 | 422 | 77.89% | 646 |
| Taney County, MO | 8,320 | 1,813 | 88.23% | 979 |
| Tangipahoa Parish, LA | 22,758 | 5,265 | 89.77% | 2328 |
| Taos County, NM | 4,237 | 1,173 | 59.61% | 1711 |
| Tarrant County, TX | 397,414 | 61,341 | 99.33% | 2651 |
| Tate County, MS | 4,802 | 1,152 | 85.56% | 694 |
| Tattnall County, GA | 3,792 | 1,192 | 71.63% | 1076 |
| Taylor County, FL | 3,037 | 910 | 65.40% | 1051 |
| Taylor County, GA | 1,178 | 396 | 86.25% | 162 |
| Taylor County, IA | 1,025 | 148 | 69.95% | 308 |
| Taylor County, KY | 3,940 | 1,059 | 91.33% | 341 |
| Taylor County, TX | 23,470 | 5,318 | 97.92% | 488 |
| Taylor County, WI | 3,495 | 506 | 42.07% | 2025 |
| Taylor County, WV | 2,470 | 500 | 87.11% | 318 |
| Tazewell County, IL | 21,846 | 2,182 | 92.48% | 1642 |
| Tazewell County, VA | 5,723 | 1,290 | 95.65% | 249 |
| Tehama County, CA | 10,942 | 2,525 | 56.18% | 4795 |
| Telfair County, GA | 1,894 | 646 | 77.79% | 421 |
| Teller County, CO | 3,233 | 377 | 66.65% | 1078 |
| Terrebonne Parish, LA | 20,001 | 4,484 | 99.88% | 23 |
| Terrell County, GA | 1,463 | 633 | 76.30% | 347 |
| Terrell County, TX | 119 | 26 | 3.56% | 115 |
| Terry County, TX | 2,377 | 774 | 57.08% | 1020 |
| Teton County, ID | 2,111 | 219 | 86.16% | 292 |
| Teton County, MT | 940 | 198 | 26.97% | 686 |
| Teton County, WY | 3,061 | 180 | 96.03% | 121 |
| Texas County, MO | 3,873 | 1,231 | 51.40% | 1882 |
| Texas County, OK | 3,909 | 673 | 84.18% | 619 |
| Thayer County, NE | 820 | 114 | 68.78% | 256 |
| Thomas County, GA | 7,571 | 2,127 | 89.59% | 788 |
| Thomas County, KS | 1,214 | 137 | 90.59% | 114 |
| Thomas County, NE | 124 | 27 | 34.00% | 82 |
| Throckmorton County, TX | 222 | 50 | 62.52% | 83 |
| Thurston County, WA | 43,740 | 4,026 | 98.64% | 597 |
| Tift County, GA | 7,135 | 2,144 | 90.22% | 698 |
| Tillamook County, OR | 3,616 | 632 | 94.38% | 203 |
| Tillman County, OK | 1,206 | 360 | 83.12% | 204 |
| Tioga County, NY | 7,518 | 1,038 | 92.69% | 549 |
| Tioga County, PA | 5,738 | 1,206 | 77.06% | 1316 |
| Tippah County, MS | 3,928 | 844 | 88.75% | 442 |
| Tippecanoe County, IN | 27,766 | 3,776 | 90.44% | 2655 |
| Tipton County, IN | 2,254 | 224 | 81.26% | 422 |
| Tipton County, TN | 11,287 | 1,908 | 94.39% | 633 |
| Tishomingo County, MS | 3,068 | 613 | 59.91% | 1230 |
| Titus County, TX | 6,852 | 1,956 | 65.78% | 2345 |
| Todd County, KY | 2,369 | 542 | 71.01% | 687 |
| Todd County, MN | 4,070 | 633 | 64.94% | 1427 |
| Todd County, SD | 2,967 | 1,441 | 63.97% | 1069 |
| Tolland County, CT | 19,621 | 1,096 | 96.82% | 623 |
| Tom Green County, TX | 19,890 | 4,702 | 90.64% | 1862 |
| Tompkins County, NY | 10,557 | 1,292 | 96.43% | 376 |
| Tooele County, UT | 16,942 | 1,104 | 94.75% | 889 |
| Toole County, MT | 641 | 108 | 28.51% | 458 |
| Toombs County, GA | 5,092 | 2,029 | 66.24% | 1719 |
| Towner County, ND | 343 | 33 | 87.18% | 44 |
| Towns County, GA | 1,063 | 249 | 95.89% | 44 |
| Traill County, ND | 1,329 | 96 | 85.49% | 193 |
| Transylvania County, NC | 3,808 | 811 | 83.92% | 612 |
| Traverse County, MN | 497 | 104 | 61.27% | 192 |
| Travis County, TX | 189,378 | 26,892 | 99.29% | 1351 |
| Treasure County, MT | 85 | 21 | 53.06% | 40 |
| Trego County, KS | 339 | 55 | 87.24% | 43 |
| Trempealeau County, WI | 5,109 | 515 | 88.03% | 612 |
| Trigg County, KY | 2,365 | 539 | 81.47% | 438 |
| Trimble County, KY | 1,355 | 275 | 81.29% | 253 |
| Trinity County, CA | 1,526 | 452 | 26.19% | 1126 |
| Trinity County, TX | 2,131 | 620 | 64.36% | 759 |
| Tripp County, SD | 864 | 260 | 90.59% | 81 |
| Troup County, GA | 12,128 | 3,267 | 96.97% | 368 |
| Trousdale County, TN | 1,362 | 256 | 71.46% | 389 |
| Trumbull County, OH | 29,601 | 6,586 | 96.91% | 915 |
| Tucker County, WV | 711 | 154 | 56.41% | 310 |
| Tulare County, CA | 104,661 | 29,097 | 88.01% | 12552 |
| Tulsa County, OK | 115,220 | 20,616 | 98.70% | 1500 |
| Tunica County, MS | 2,038 | 914 | 78.24% | 443 |
| Tuolumne County, CA | 6,577 | 1,005 | 74.77% | 1660 |
| Turner County, GA | 1,330 | 566 | 75.63% | 324 |
| Turner County, SD | 1,501 | 157 | 61.09% | 584 |
| Tuscaloosa County, AL | 30,625 | 6,103 | 95.76% | 1298 |
| Tuscarawas County, OH | 14,902 | 2,131 | 84.53% | 2305 |
| Tuscola County, MI | 7,607 | 1,253 | 66.31% | 2563 |
| Twin Falls County, ID | 17,098 | 2,635 | 86.34% | 2336 |
| Tyler County, TX | 3,071 | 764 | 36.50% | 1950 |
| Tyler County, WV | 1,228 | 264 | 29.64% | 864 |
| Tyrrell County, NC | 533 | 195 | 85.73% | 76 |
| Uinta County, WY | 4,298 | 454 | 73.87% | 1123 |
| Uintah County, UT | 8,582 | 1,044 | 90.81% | 789 |
| Ulster County, NY | 22,899 | 3,470 | 99.70% | 69 |
| Umatilla County, OR | 14,093 | 2,786 | 88.06% | 1683 |
| Unicoi County, TN | 2,450 | 521 | 96.72% | 80 |
| Union County, AR | 6,741 | 1,597 | 75.13% | 1677 |
| Union County, FL | 2,056 | 414 | 50.50% | 1018 |
| Union County, GA | 2,856 | 619 | 93.54% | 184 |
| Union County, IA | 2,005 | 307 | 88.02% | 240 |
| Union County, IL | 2,573 | 573 | 59.07% | 1053 |
| Union County, IN | 1,029 | 164 | 49.51% | 520 |
| Union County, KY | 1,829 | 381 | 82.07% | 328 |
| Union County, MS | 5,155 | 895 | 68.22% | 1638 |
| Union County, NC | 49,124 | 4,087 | 98.81% | 585 |
| Union County, NJ | 94,413 | 9,544 | 99.73% | 251 |
| Union County, NM | 563 | 149 | 60.34% | 223 |
| Union County, OH | 10,391 | 471 | 80.00% | 2078 |
| Union County, OR | 4,263 | 692 | 70.23% | 1269 |
| Union County, PA | 5,904 | 722 | 68.84% | 1840 |
| Union County, SC | 4,009 | 1,296 | 83.69% | 654 |
| Union County, SD | 2,802 | 150 | 85.96% | 393 |
| Union County, TN | 3,133 | 813 | 81.62% | 576 |
| Union Parish, LA | 3,550 | 984 | 40.39% | 2116 |
| Upshur County, TX | 7,215 | 1,456 | 88.18% | 853 |
| Upshur County, WV | 3,610 | 877 | 72.68% | 986 |
| Upson County, GA | 4,085 | 1,385 | 92.97% | 287 |
| Upton County, TX | 773 | 150 | 65.60% | 266 |
| Utah County, UT | 146,753 | 10,621 | 98.43% | 2299 |
| Uvalde County, TX | 5,241 | 1,703 | 87.54% | 653 |
| Val Verde County, TX | 9,642 | 2,860 | 97.36% | 255 |
| Valdez-Cordova Census Area, AK | 1,495 | 175 | 87.15% | 192 |
| Valencia County, NM | 13,162 | 2,942 | 87.39% | 1659 |
| Valley County, ID | 1,478 | 193 | 56.68% | 640 |
| Valley County, MT | 1,221 | 192 | 82.10% | 219 |
| Valley County, NE | 685 | 106 | 53.69% | 317 |
| Van Buren County, AR | 2,449 | 616 | 10.51% | 2192 |
| Van Buren County, IA | 1,167 | 233 | 47.87% | 608 |
| Van Buren County, MI | 12,637 | 2,633 | 79.03% | 2650 |
| Van Buren County, TN | 768 | 224 | 49.46% | 388 |
| Van Wert County, OH | 4,607 | 512 | 76.25% | 1094 |
| Van Zandt County, TX | 9,402 | 1,818 | 40.06% | 5635 |
| Vance County, NC | 7,497 | 2,466 | 96.47% | 265 |
| Vanderburgh County, IN | 27,311 | 5,309 | 99.10% | 246 |
| Venango County, PA | 7,140 | 1,339 | 90.45% | 682 |
| Ventura County, CA | 141,872 | 17,458 | 98.59% | 1999 |
| Vermilion County, IL | 12,798 | 3,472 | 82.58% | 2229 |
| Vermilion Parish, LA | 11,137 | 2,671 | 96.47% | 393 |
| Vermillion County, IN | 2,443 | 475 | 74.18% | 631 |
| Vernon County, MO | 3,360 | 761 | 57.57% | 1426 |
| Vernon County, WI | 5,767 | 1,115 | 80.00% | 1153 |
| Vernon Parish, LA | 8,047 | 1,926 | 74.76% | 2031 |
| Victoria County, TX | 16,516 | 3,394 | 82.04% | 2966 |
| Vigo County, IN | 15,167 | 2,758 | 94.07% | 899 |
| Vilas County, WI | 2,664 | 503 | 45.66% | 1448 |
| Vinton County, OH | 2,069 | 571 | 38.21% | 1279 |
| Virginia Beach city, VA | 70,007 | 6,467 | 97.93% | 1452 |
| Volusia County, FL | 69,128 | 11,938 | 98.46% | 1063 |
| Wabash County, IL | 1,836 | 320 | 66.95% | 607 |
| Wabash County, IN | 4,522 | 716 | 68.01% | 1446 |
| Wabasha County, MN | 3,420 | 244 | 77.18% | 780 |
| Wabaunsee County, KS | 1,188 | 111 | 32.37% | 803 |
| Wadena County, MN | 2,497 | 416 | 92.74% | 181 |
| Wagoner County, OK | 14,488 | 1,882 | 87.46% | 1816 |
| Wahkiakum County, WA | 603 | 104 | 19.86% | 483 |
| Wake County, NC | 190,652 | 18,532 | 99.89% | 203 |
| Wakulla County, FL | 5,064 | 781 | 93.59% | 325 |
| Waldo County, ME | 5,271 | 934 | 75.78% | 1277 |
| Walker County, AL | 10,062 | 2,413 | 86.66% | 1342 |
| Walker County, GA | 10,931 | 2,209 | 95.67% | 474 |
| Walker County, TX | 7,515 | 2,057 | 76.25% | 1785 |
| Walla Walla County, WA | 9,227 | 1,309 | 99.90% | 9 |
| Wallace County, KS | 258 | 40 | 48.82% | 132 |
| Waller County, TX | 9,264 | 1,756 | 51.59% | 4485 |
| Wallowa County, OR | 947 | 170 | 0.68% | 941 |
| Walsh County, ND | 1,696 | 202 | 86.53% | 228 |
| Walton County, FL | 10,108 | 1,890 | 84.94% | 1522 |
| Walton County, GA | 17,089 | 2,911 | 90.43% | 1635 |
| Walworth County, SD | 914 | 165 | 98.99% | 9 |
| Walworth County, WI | 15,959 | 1,456 | 90.46% | 1522 |
| Wapello County, IA | 5,461 | 1,054 | 88.61% | 622 |
| Ward County, ND | 10,582 | 886 | 95.63% | 462 |
| Ward County, TX | 2,421 | 411 | 49.76% | 1216 |
| Ware County, GA | 5,977 | 1,981 | 85.86% | 845 |
| Warren County, IA | 9,365 | 586 | 90.88% | 855 |
| Warren County, IL | 2,640 | 424 | 71.81% | 744 |
| Warren County, IN | 1,365 | 206 | 32.85% | 917 |
| Warren County, KY | 20,916 | 3,815 | 96.10% | 816 |
| Warren County, MO | 5,885 | 801 | 80.78% | 1131 |
| Warren County, MS | 7,969 | 2,411 | 98.20% | 144 |
| Warren County, NC | 2,634 | 782 | 70.71% | 772 |
| Warren County, NJ | 15,758 | 1,286 | 99.21% | 124 |
| Warren County, NY | 8,615 | 1,225 | 93.02% | 602 |
| Warren County, OH | 43,277 | 2,496 | 97.43% | 1113 |
| Warren County, PA | 5,454 | 947 | 73.39% | 1452 |
| Warren County, TN | 6,950 | 2,192 | 81.35% | 1296 |
| Warren County, VA | 6,239 | 801 | 91.15% | 552 |
| Warrick County, IN | 11,276 | 804 | 83.32% | 1881 |
| Wasatch County, UT | 7,836 | 446 | 89.86% | 795 |
| Wasco County, OR | 3,996 | 755 | 82.88% | 684 |
| Waseca County, MN | 3,186 | 360 | 71.29% | 915 |
| Washakie County, WY | 1,320 | 191 | 86.14% | 183 |
| Washburn County, WI | 2,219 | 360 | 55.94% | 978 |
| Washington County, AL | 2,687 | 659 | 54.00% | 1236 |
| Washington County, AR | 40,532 | 5,851 | 95.98% | 1630 |
| Washington County, CO | 811 | 152 | 48.98% | 414 |
| Washington County, GA | 3,174 | 1,310 | 70.06% | 950 |
| Washington County, IA | 3,865 | 427 | 87.19% | 495 |
| Washington County, ID | 1,693 | 341 | 64.02% | 609 |
| Washington County, IL | 2,130 | 210 | 42.94% | 1215 |
| Washington County, IN | 4,556 | 868 | 94.11% | 268 |
| Washington County, KS | 836 | 144 | 58.73% | 345 |
| Washington County, KY | 2,036 | 416 | 36.51% | 1293 |
| Washington County, MD | 23,683 | 3,566 | 94.87% | 1216 |
| Washington County, ME | 4,233 | 1,062 | 88.17% | 501 |
| Washington County, MN | 47,439 | 1,908 | 98.00% | 947 |
| Washington County, MO | 4,097 | 1,032 | 15.18% | 3475 |
| Washington County, MS | 8,305 | 4,431 | 94.12% | 488 |
| Washington County, NC | 1,727 | 669 | 93.26% | 116 |
| Washington County, NE | 3,738 | 227 | 70.54% | 1101 |
| Washington County, NY | 8,265 | 1,258 | 87.61% | 1024 |
| Washington County, OH | 8,650 | 1,731 | 79.71% | 1755 |
| Washington County, OK | 8,928 | 1,499 | 79.95% | 1790 |
| Washington County, OR | 98,913 | 8,961 | 97.59% | 2383 |
| Washington County, PA | 29,368 | 2,826 | 94.26% | 1685 |
| Washington County, RI | 15,638 | 1,268 | 97.74% | 354 |
| Washington County, TN | 17,747 | 2,921 | 98.15% | 328 |
| Washington County, TX | 5,484 | 993 | 65.79% | 1876 |
| Washington County, UT | 32,328 | 3,596 | 91.35% | 2795 |
| Washington County, VA | 7,354 | 1,262 | 99.20% | 59 |
| Washington County, VT | 7,898 | 862 | 91.61% | 662 |
| Washington County, WI | 22,156 | 947 | 95.27% | 1048 |
| Washington Parish, LA | 7,966 | 3,028 | 68.87% | 2480 |
| Washita County, OK | 1,989 | 457 | 65.94% | 677 |
| Washoe County, NV | 71,215 | 7,548 | 98.69% | 934 |
| Washtenaw County, MI | 50,048 | 5,725 | 96.32% | 1840 |
| Watauga County, NC | 5,201 | 740 | 98.42% | 82 |
| Watonwan County, MN | 1,880 | 255 | 71.40% | 538 |
| Waukesha County, WI | 64,452 | 2,762 | 99.93% | 45 |
| Waupaca County, WI | 7,471 | 941 | 71.72% | 2113 |
| Waushara County, WI | 3,181 | 488 | 49.78% | 1597 |
| Wayne County, GA | 5,244 | 1,452 | 80.12% | 1042 |
| Wayne County, IA | 1,163 | 250 | 86.21% | 160 |
| Wayne County, IL | 2,619 | 571 | 77.61% | 586 |
| Wayne County, IN | 10,354 | 2,206 | 83.09% | 1751 |
| Wayne County, KY | 2,934 | 957 | 76.97% | 676 |
| Wayne County, MI | 293,781 | 91,928 | 99.45% | 1617 |
| Wayne County, MS | 3,561 | 1,124 | 75.53% | 871 |
| Wayne County, NC | 20,618 | 6,072 | 97.06% | 606 |
| Wayne County, NE | 1,341 | 119 | 78.85% | 284 |
| Wayne County, NY | 13,977 | 1,812 | 93.99% | 840 |
| Wayne County, OH | 20,051 | 2,697 | 91.44% | 1716 |
| Wayne County, PA | 6,187 | 1,124 | 58.04% | 2596 |
| Wayne County, TN | 2,022 | 507 | 54.09% | 928 |
| Wayne County, UT | 494 | 81 | 89.52% | 52 |
| Wayne County, WV | 5,910 | 1,413 | 82.02% | 1063 |
| Waynesboro city, VA | 3,603 | 864 | 98.38% | 58 |
| Weakley County, TN | 4,645 | 992 | 59.08% | 1901 |
| Webb County, TX | 64,288 | 21,267 | 98.30% | 1095 |
| Weber County, UT | 51,898 | 5,421 | 95.96% | 2094 |
| Webster County, IA | 5,500 | 955 | 93.93% | 334 |
| Webster County, KY | 2,133 | 475 | 71.32% | 612 |
| Webster County, MO | 7,555 | 1,781 | 68.84% | 2354 |
| Webster County, MS | 1,717 | 415 | 48.29% | 888 |
| Webster County, NE | 592 | 84 | 86.80% | 78 |
| Webster County, WV | 1,229 | 429 | 66.92% | 407 |
| Webster Parish, LA | 6,277 | 2,047 | 79.48% | 1288 |
| Weld County, CO | 58,618 | 7,336 | 84.61% | 9022 |
| Wells County, IN | 4,975 | 552 | 72.95% | 1346 |
| Wells County, ND | 598 | 78 | 97.50% | 15 |
| West Baton Rouge Parish, LA | 4,536 | 869 | 94.69% | 241 |
| West Feliciana Parish, LA | 1,851 | 335 | 84.54% | 286 |
| Westchester County, NY | 154,356 | 13,753 | 100.00% | 2 |
| Westmoreland County, PA | 47,337 | 5,174 | 97.66% | 1110 |
| Westmoreland County, VA | 2,332 | 588 | 89.30% | 250 |
| Weston County, WY | 1,054 | 150 | 52.01% | 506 |
| Wetzel County, WV | 2,166 | 502 | 47.90% | 1128 |
| Wexford County, MI | 5,498 | 1,060 | 65.15% | 1916 |
| Wharton County, TX | 7,807 | 1,779 | 64.78% | 2750 |
| Whatcom County, WA | 31,228 | 4,081 | 93.37% | 2070 |
| Wheatland County, MT | 361 | 91 | 94.79% | 19 |
| Wheeler County, NE | 106 | 21 | 54.16% | 49 |
| Wheeler County, TX | 952 | 189 | 26.03% | 704 |
| White County, AR | 13,152 | 2,708 | 68.38% | 4159 |
| White County, GA | 4,442 | 945 | 84.43% | 692 |
| White County, IL | 2,124 | 391 | 69.95% | 638 |
| White County, IN | 4,050 | 511 | 84.79% | 616 |
| White County, TN | 4,234 | 971 | 67.47% | 1377 |
| White Pine County, NV | 1,316 | 187 | 0.00% | 1316 |
| Whiteside County, IL | 8,841 | 1,405 | 83.85% | 1428 |
| Whitfield County, GA | 19,676 | 3,421 | 100.00% | - |
| Whitley County, IN | 5,651 | 478 | 72.08% | 1578 |
| Whitley County, KY | 6,190 | 2,083 | 96.65% | 208 |
| Whitman County, WA | 5,273 | 578 | 73.36% | 1405 |
| Wibaux County, MT | 152 | 20 | 7.37% | 141 |
| Wichita County, KS | 425 | 73 | 63.12% | 157 |
| Wichita County, TX | 20,873 | 4,311 | 92.82% | 1498 |
| Wicomico County, MD | 16,103 | 3,356 | 92.85% | 1152 |
| Wilbarger County, TX | 1,986 | 439 | 94.32% | 113 |
| Wilcox County, GA | 1,160 | 386 | 62.73% | 432 |
| Wilkes County, GA | 1,542 | 468 | 100.00% | - |
| Wilkes County, NC | 10,219 | 2,707 | 99.28% | 73 |
| Wilkin County, MN | 980 | 129 | 84.76% | 149 |
| Wilkinson County, GA | 1,517 | 587 | 60.50% | 599 |
| Wilkinson County, MS | 1,394 | 521 | 65.88% | 476 |
| Will County, IL | 130,109 | 10,327 | 98.53% | 1914 |
| Willacy County, TX | 3,671 | 1,648 | 93.80% | 228 |
| Williams County, ND | 6,634 | 471 | 96.50% | 233 |
| Williams County, OH | 6,000 | 794 | 71.31% | 1721 |
| Williamsburg city, VA | 1,188 | 316 | 69.89% | 358 |
| Williamsburg County, SC | 4,729 | 1,770 | 79.18% | 985 |
| Williamson County, IL | 10,459 | 1,967 | 84.63% | 1608 |
| Williamson County, TN | 49,065 | 1,563 | 96.99% | 1479 |
| Williamson County, TX | 107,019 | 7,340 | 95.58% | 4732 |
| Wilson County, KS | 1,498 | 302 | 40.28% | 895 |
| Wilson County, NC | 13,528 | 4,006 | 98.31% | 228 |
| Wilson County, TN | 24,524 | 2,197 | 98.52% | 362 |
| Wilson County, TX | 8,895 | 1,252 | 18.13% | 7282 |
| Winchester city, VA | 4,335 | 940 | 99.75% | 11 |
| Windham County, CT | 16,833 | 2,334 | 99.10% | 152 |
| Windham County, VT | 5,335 | 712 | 88.93% | 591 |
| Windsor County, VT | 7,279 | 771 | 94.98% | 365 |
| Winkler County, TX | 1,686 | 321 | 32.86% | 1132 |
| Winn Parish, LA | 2,085 | 577 | 51.34% | 1015 |
| Winnebago County, IA | 1,708 | 214 | 98.45% | 26 |
| Winnebago County, IL | 47,256 | 11,971 | 96.70% | 1562 |
| Winnebago County, WI | 24,922 | 2,647 | 96.76% | 808 |
| Winneshiek County, IA | 2,750 | 254 | 59.71% | 1108 |
| Winona County, MN | 6,538 | 647 | 89.78% | 668 |
| Winston County, AL | 3,493 | 915 | 65.81% | 1194 |
| Winston County, MS | 3,078 | 932 | 82.92% | 526 |
| Wirt County, WV | 924 | 234 | 48.19% | 479 |
| Wise County, TX | 12,424 | 1,657 | 35.21% | 8050 |
| Wise County, VA | 5,355 | 1,615 | 96.26% | 200 |
| Wolfe County, KY | 1,152 | 470 | 84.79% | 175 |
| Wood County, OH | 19,081 | 1,732 | 92.82% | 1370 |
| Wood County, TX | 6,318 | 1,488 | 64.92% | 2217 |
| Wood County, WI | 11,289 | 1,355 | 85.27% | 1663 |
| Wood County, WV | 12,419 | 2,425 | 93.44% | 815 |
| Woodbury County, IA | 18,867 | 3,634 | 92.39% | 1436 |
| Woodford County, IL | 6,939 | 495 | 85.14% | 1031 |
| Woodford County, KY | 4,202 | 514 | 98.31% | 71 |
| Woods County, OK | 1,223 | 209 | 87.72% | 150 |
| Woodson County, KS | 485 | 106 | 48.66% | 249 |
| Woodward County, OK | 3,535 | 763 | 14.98% | 3005 |
| Worcester County, MA | 126,952 | 12,592 | 98.68% | 1675 |
| Worcester County, MD | 6,626 | 1,121 | 88.67% | 751 |
| Worth County, GA | 3,308 | 1,127 | 72.60% | 907 |
| Worth County, IA | 1,101 | 165 | 97.66% | 26 |
| Worth County, MO | 298 | 56 | 58.50% | 124 |
| Wrangell City and Borough, AK | 375 | 51 | 90.08% | 37 |
| Wright County, IA | 2,155 | 352 | 74.14% | 557 |
| Wright County, MN | 27,970 | 1,009 | 89.59% | 2911 |
| Wyandot County, OH | 3,583 | 335 | 71.10% | 1035 |
| Wyandotte County, KS | 31,995 | 8,032 | 99.93% | 24 |
| Wyoming County, NY | 5,453 | 645 | 84.46% | 847 |
| Wyoming County, PA | 3,783 | 593 | 89.42% | 400 |
| Wyoming County, WV | 3,152 | 839 | 94.00% | 189 |
| Wythe County, VA | 4,142 | 830 | 86.97% | 540 |
| Yadkin County, NC | 5,696 | 1,150 | 99.27% | 42 |
| Yakima County, WA | 53,147 | 11,136 | 82.39% | 9359 |
| Yakutat Borough, AK | 77 | 12 | 0.00% | 77 |
| Yalobusha County, MS | 1,981 | 586 | 81.42% | 368 |
| Yamhill County, OR | 17,007 | 2,024 | 83.34% | 2833 |
| Yancey County, NC | 2,394 | 557 | 91.23% | 210 |
| Yankton County, SD | 3,380 | 361 | 86.11% | 469 |
| Yates County, NY | 3,791 | 760 | 71.49% | 1081 |
| Yavapai County, AZ | 27,320 | 4,889 | 86.99% | 3554 |
| Yazoo County, MS | 4,584 | 1,706 | 71.90% | 1288 |
| Yell County, AR | 3,837 | 896 | 81.19% | 722 |
| Yellow Medicine County, MN | 1,646 | 242 | 45.95% | 890 |
| Yellowstone County, MT | 26,715 | 2,939 | 94.75% | 1403 |
| Yoakum County, TX | 2,023 | 319 | 79.19% | 421 |
| Yolo County, CA | 33,352 | 4,888 | 94.93% | 1690 |
| York County, ME | 27,849 | 2,566 | 99.55% | 126 |
| York County, NE | 2,201 | 245 | 82.31% | 389 |
| York County, PA | 71,759 | 8,701 | 97.07% | 2106 |
| York County, SC | 49,089 | 5,945 | 97.46% | 1248 |
| York County, VA | 12,230 | 711 | 98.81% | 146 |
| Young County, TX | 3,193 | 623 | 78.30% | 693 |
| Yuba County, CA | 15,094 | 3,333 | 85.24% | 2228 |
| Yukon-Koyukuk Census Area, AK | 1,064 | 300 | 0.00% | 1064 |
| Yuma County, AZ | 37,880 | 10,077 | 91.97% | 3043 |
| Yuma County, CO | 1,947 | 303 | 64.86% | 684 |
| Zapata County, TX | 3,403 | 1,583 | 92.34% | 261 |
| Zavala County, TX | 2,574 | 1,116 | 72.48% | 708 |
| Ziebach County, SD | 606 | 200 | 98.11% | 11 |
Most At-Risk States
Georgia, Missouri and Arkansas make up over 30% of internet desert counties. Louisiana, New Mexico, Texas, Alabama and Mississippi all have at least seven of these counties as well, and as such, they represent the areas with the most potential for disruption in the fall. This is especially true when you consider that many of these states are currently experiencing surges in coronavirus cases, which could lead to additional lockdown measures.
Any national efforts to provide bandaid solutions for the fall should be prioritized in these states:
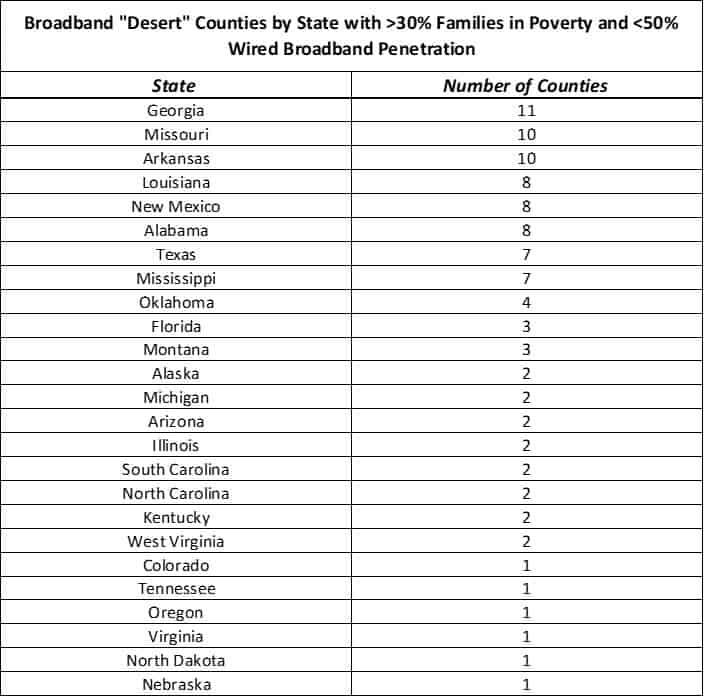
The Importance of Broadband in Schooling
An adequate broadband connection enhances student education in a variety of ways. Technology has become inseparable from the learning process at thousands of schools, and according to Information Superhighway, 98% of public schools have access to high-speed broadband.
However, the same report claims that 2.3 million students are left behind, in that their school does not have access to the minimum connectivity for online learning. It is crucial to close this gap as well, but right now, with fall semesters going online for millions of students, it is vital that we provide the ability for young learners to have access to things like Zoom meetings, interactive coursework, and more.
Looking for more information on internet access in the U.S.?
- Find detailed pricing information for internet service providers like Cox, AT&T, and Verizon Fios.
- You can also view a full list of all internet service providers in the U.S.
- See how all 50 states rank for internet access, pricing, and speeds. You can also view individual state data for every state, including Montana, Washington, and California.
- Check out in depth broadband statistics for every city in the county, including internet access in Dallas, Los Angeles, and Detroit.
Potential Solutions
Several different short-term tactics for bringing more students and schools online have been proposed by local and federal government agencies. However, we believe that the only lasting solution will be a complete and total closing of the longstanding digital divide, likely through a concerted effort between both the public and private sectors.
Short-term
Many state and federal governments have been experimenting with direct hotspot deployment to homes in communities where a disproportionate amount of students are living without an internet connection. However, this strategy is largely scattershot, and there aren’t nearly enough devices available to be viable nationwide.
Other ideas, such as deploying WiFi-equipped school busses to parking lots, apartment buildings and neighborhoods have seen mixed success as well. Some districts, such as The School District of Philadelphia, have pulled back on the idea after community members raised various concerns, including ones of safety for the students and their belongings in high-crime areas.
Long-term
The only true long-term solution to this unprecedented issue would be complete proliferation of robust, affordable broadband to every home in the U.S. This has proven difficult to accomplish via the current systems and technologies relied upon by the FCC and other governmental organizations, but new methods may prove to be more effective.
One new technology with promising potential is low-Earth orbit satellite, which could bring universal access to broadband internet by as soon as the end of this year. Still, leading companies deploying the technology like SpaceX have not released any specifics around how much the service will cost.
Even in the best case scenario, none of these innovative new services are likely to be ready in time for the fall 2020 semester, and as a result, districts around the nation are going to face significant challenges if they are forced to resort to online schooling once again. The situation has once again illuminated the urgent need for a change of tact when it comes to bringing internet to hard-to-service areas. Now, more than ever, our nation’s future prosperity depends on it.
About Our Data
Data in this report comes from BroadbandNow’s comprehensive census-block level coverage data of all providers in the United States, and also the Census Bureau’s Small Area Income and Poverty Estimates (SAIPE) most recent data from 2018 to calculate the number of children and number of children in poverty in a given county.